
Technical Analysis Chart
Updated July 8, 2026
Tutorial
The video below walks through how to use the technical analysis chart:
Troubleshooting
Price vs percent (%) change in chart
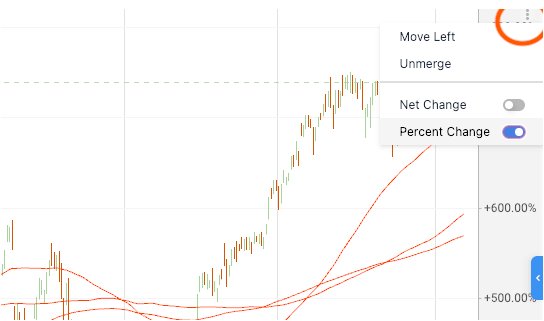
Here are the steps to take to get the chart to show price:
- Hover your mouse over the Y axis (or tap the Y axis if you're on mobile).
- An options (3-dot) menu should appear at the top.
- Once you click that, you can toggle off "percent change."
Here's a screenshot:
Change or reset colors
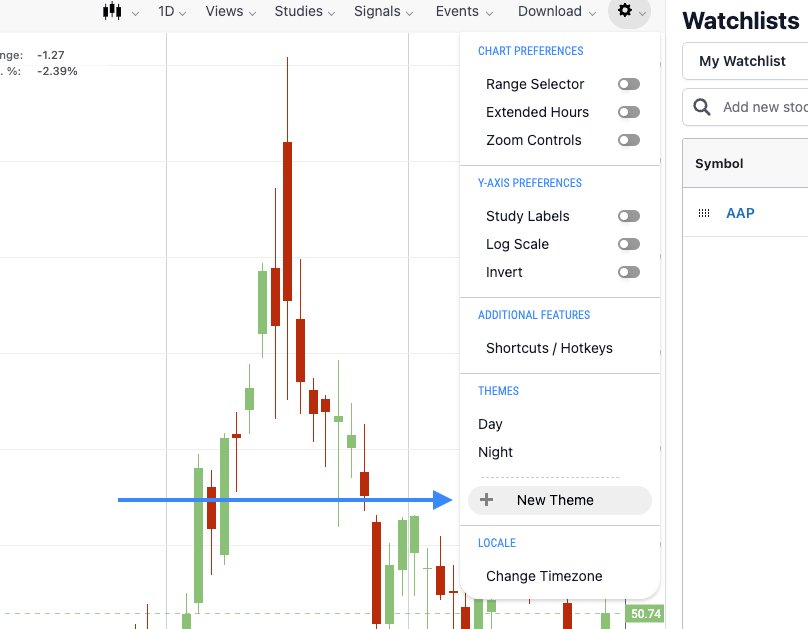
You can change the theme of the chart (located in Preferences on the top right), which allows you to change the chart colors.
To do so, hit the cog icon at the top right, and then select "new theme," like so:
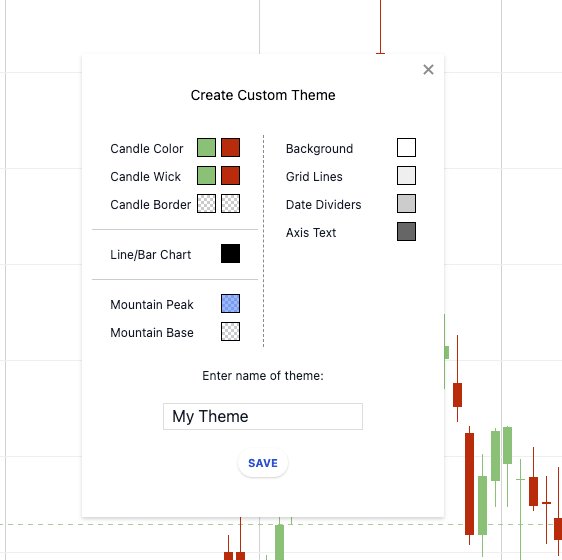
You can then change the colors:
If you select "day" or "night" under themes (see top screenshot), you can also get the colors to revert back to the defaults.