EVE Energy Co., Ltd. (SHE:300014)
 China · Delayed Price · Currency is CNY
 | Market Cap | 144.71B +50.4% |
| Revenue (ttm) | 59.57B +25.9% |
| Net Income | 3.70B -2.9% |
| EPS | 1.70 -9.2% |
| Shares Out | 2.07B |
| PE Ratio | 41.28 |
| Forward PE | 21.02 |
| Dividend | 0.49 (0.70%) |
| Ex-Dividend Date | Sep 17, 2025 |
| Volume | 74,333,840 |
| Average Volume | 67,318,156 |
| Open | 70.84 |
| Previous Close | 70.37 |
| Day's Range | 69.02 - 72.94 |
| 52-Week Range | 37.31 - 94.44 |
| Beta | 0.80 |
| RSI | 59.86 |
| Earnings Date | Mar 28, 2026 |
About EVE Energy
EVE Energy Co., Ltd. engages in the research, development, production, and sales of lithium batteries in China and internationally. It provides lithium primary batteries, including lithium-thionyl chloride battery, lithium-manganese dioxide battery, battery capacitor, and composite power supply ES. The company also offers consumer batteries, such as primary lithium and consumer small lithium-ion batteries, and cylindrical cells; and power batteries, which include prismatic LFP cell, pouch NCM cell, module, battery system development, prismatic ... [Read more]
Financial Performance
In 2024, EVE Energy's revenue was 48.61 billion, a decrease of -0.35% compared to the previous year's 48.78 billion. Earnings were 4.08 billion, an increase of 0.63%.
Financial StatementsNews
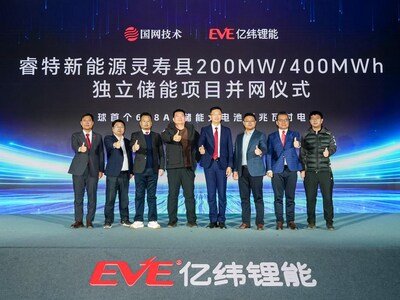
World's First 628Ah Ultra-Large Battery Energy Storage Station Connected to Grid, EVE Energy Secures Another Major 10GWh Order
SHIJIAZHUANG, China , Feb. 10, 2026 /PRNewswire/ -- On January 31, 2026 , the world's first 400MWh energy storage station using 628Ah ultra-large battery cells entered operation. Equipped with 80 sets...

China's 15th Five-Year Plan: Who Is Leading offshore Listings?
As the outlines of China's 15th Five-Year Plan take shape, offshore listing trends are becoming more structured, with certain industries moving ahead of others Image Credit: Bamboo Works After topping...
BYD, Other EV Battery Makers Face More Pressure to Cut Emissions
Electric vehicle battery suppliers, including BYD Co. and EVE Energy Co., need to step up efforts to switch to clean power at manufacturing sites and curb emissions in supply chains, according to envi...
Chinese EV battery firm Eve eyes second Malaysia plant
Eve Energy, China’s fifth-largest producer of electric vehicle (EV) batteries, unveiled plans to build its second factory in Malaysia, three weeks after it decided to raise funds with a share offering...
Chinese EV battery maker Eve Energy jumps on Hong Kong IPO bandwagon
Eve Energy, China’s fifth-largest producer of electric vehicle (EV) batteries, plans to raise fresh capital on the Hong Kong stock exchange, following the lead of its bigger rival Contemporary Amperex...

HomeKit Weekly: Eve Energy gains Matter energy reporting, Android enhancements, and Home Assistant certification
is one of those smart home products that just works. It’s been a staple in my HomeKit setup for years thanks to its reliability, privacy-first design, and native HomeKit support. Eve Energy is picking...
Tesla Secures Battery Supply Deal with EVE Energy for US Operations
Tesla Secures Battery Supply Deal with EVE Energy for US Operations