
DCF Calculator Tutorial
The DCF Calculator values a stock from the cash it's expected to produce. DCF stands for discounted cash flow: project the free cash flow for each of the next 10 years, then work out what all of it is worth in today's money.
The idea behind it is that a dollar next year is worth less than a dollar today, because you could have invested today's dollar in the meantime. So each future year gets shrunk by a discount rate before it's added up. The total, per share, is the fair value.
Everything here is free, and you don't need an account. A DCF looks precise, but small changes to the inputs move the answer a lot. The calculator is built to show you that, not hide it.
On this page
Start from a stock
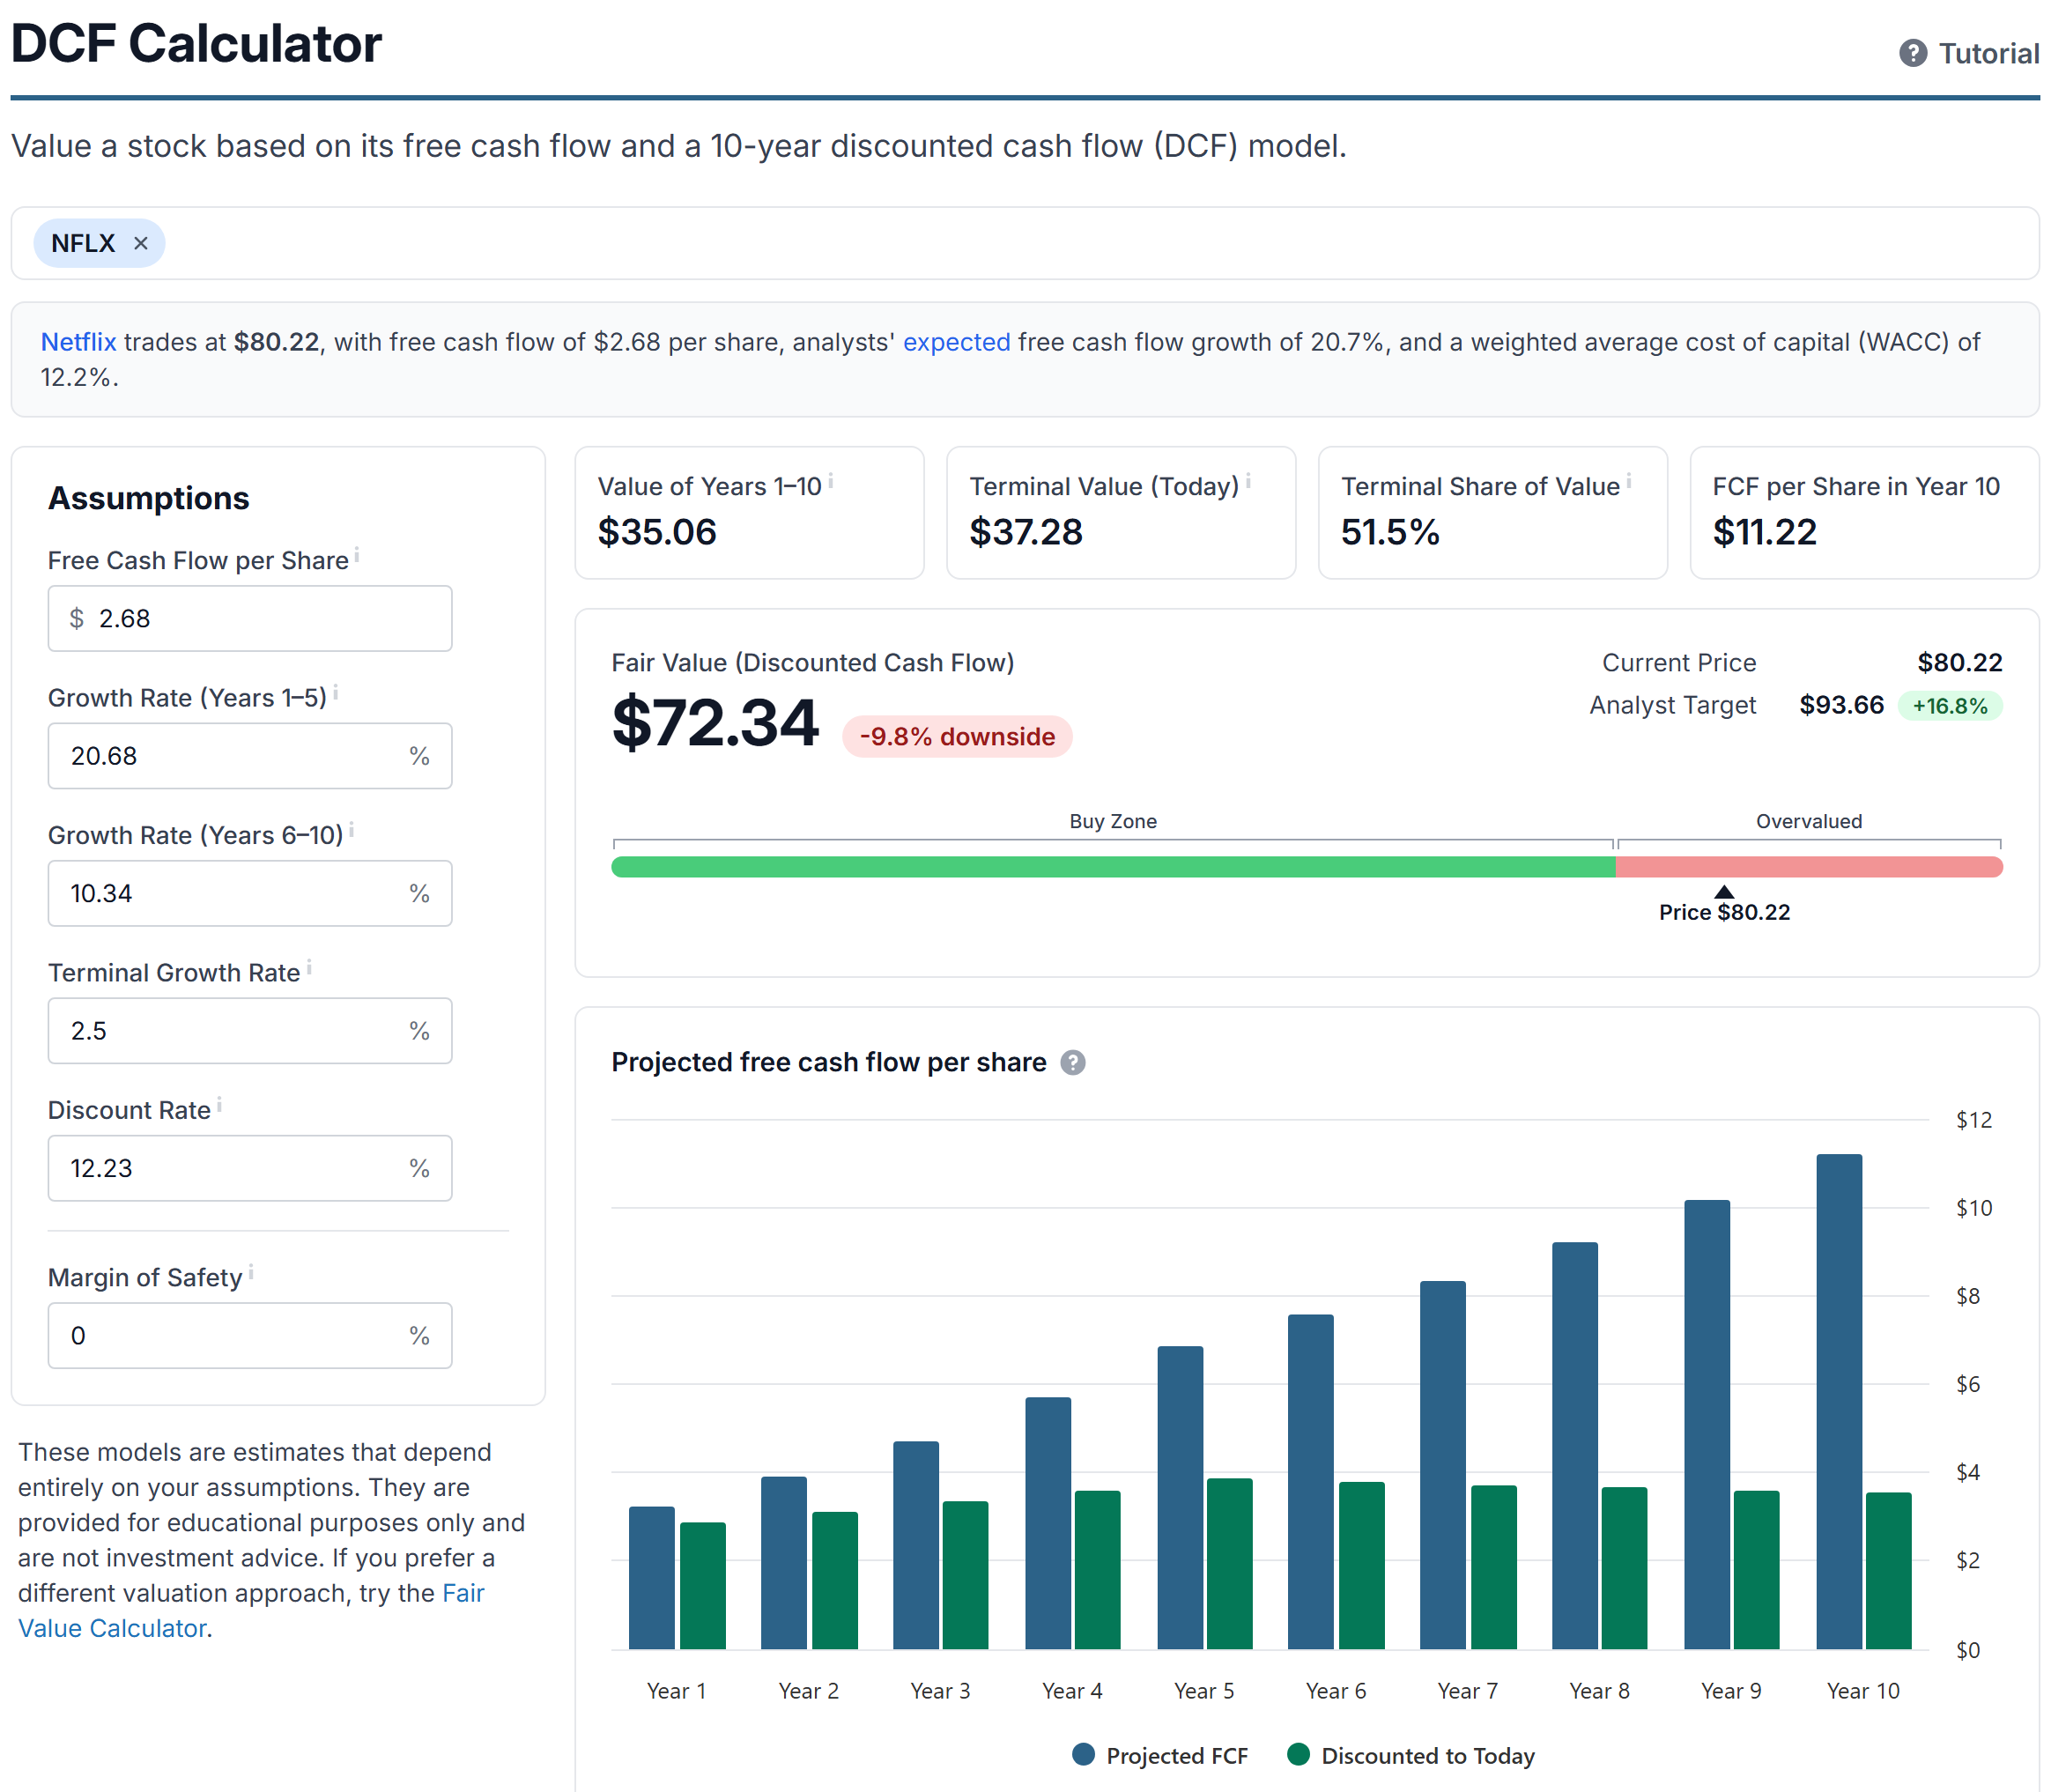
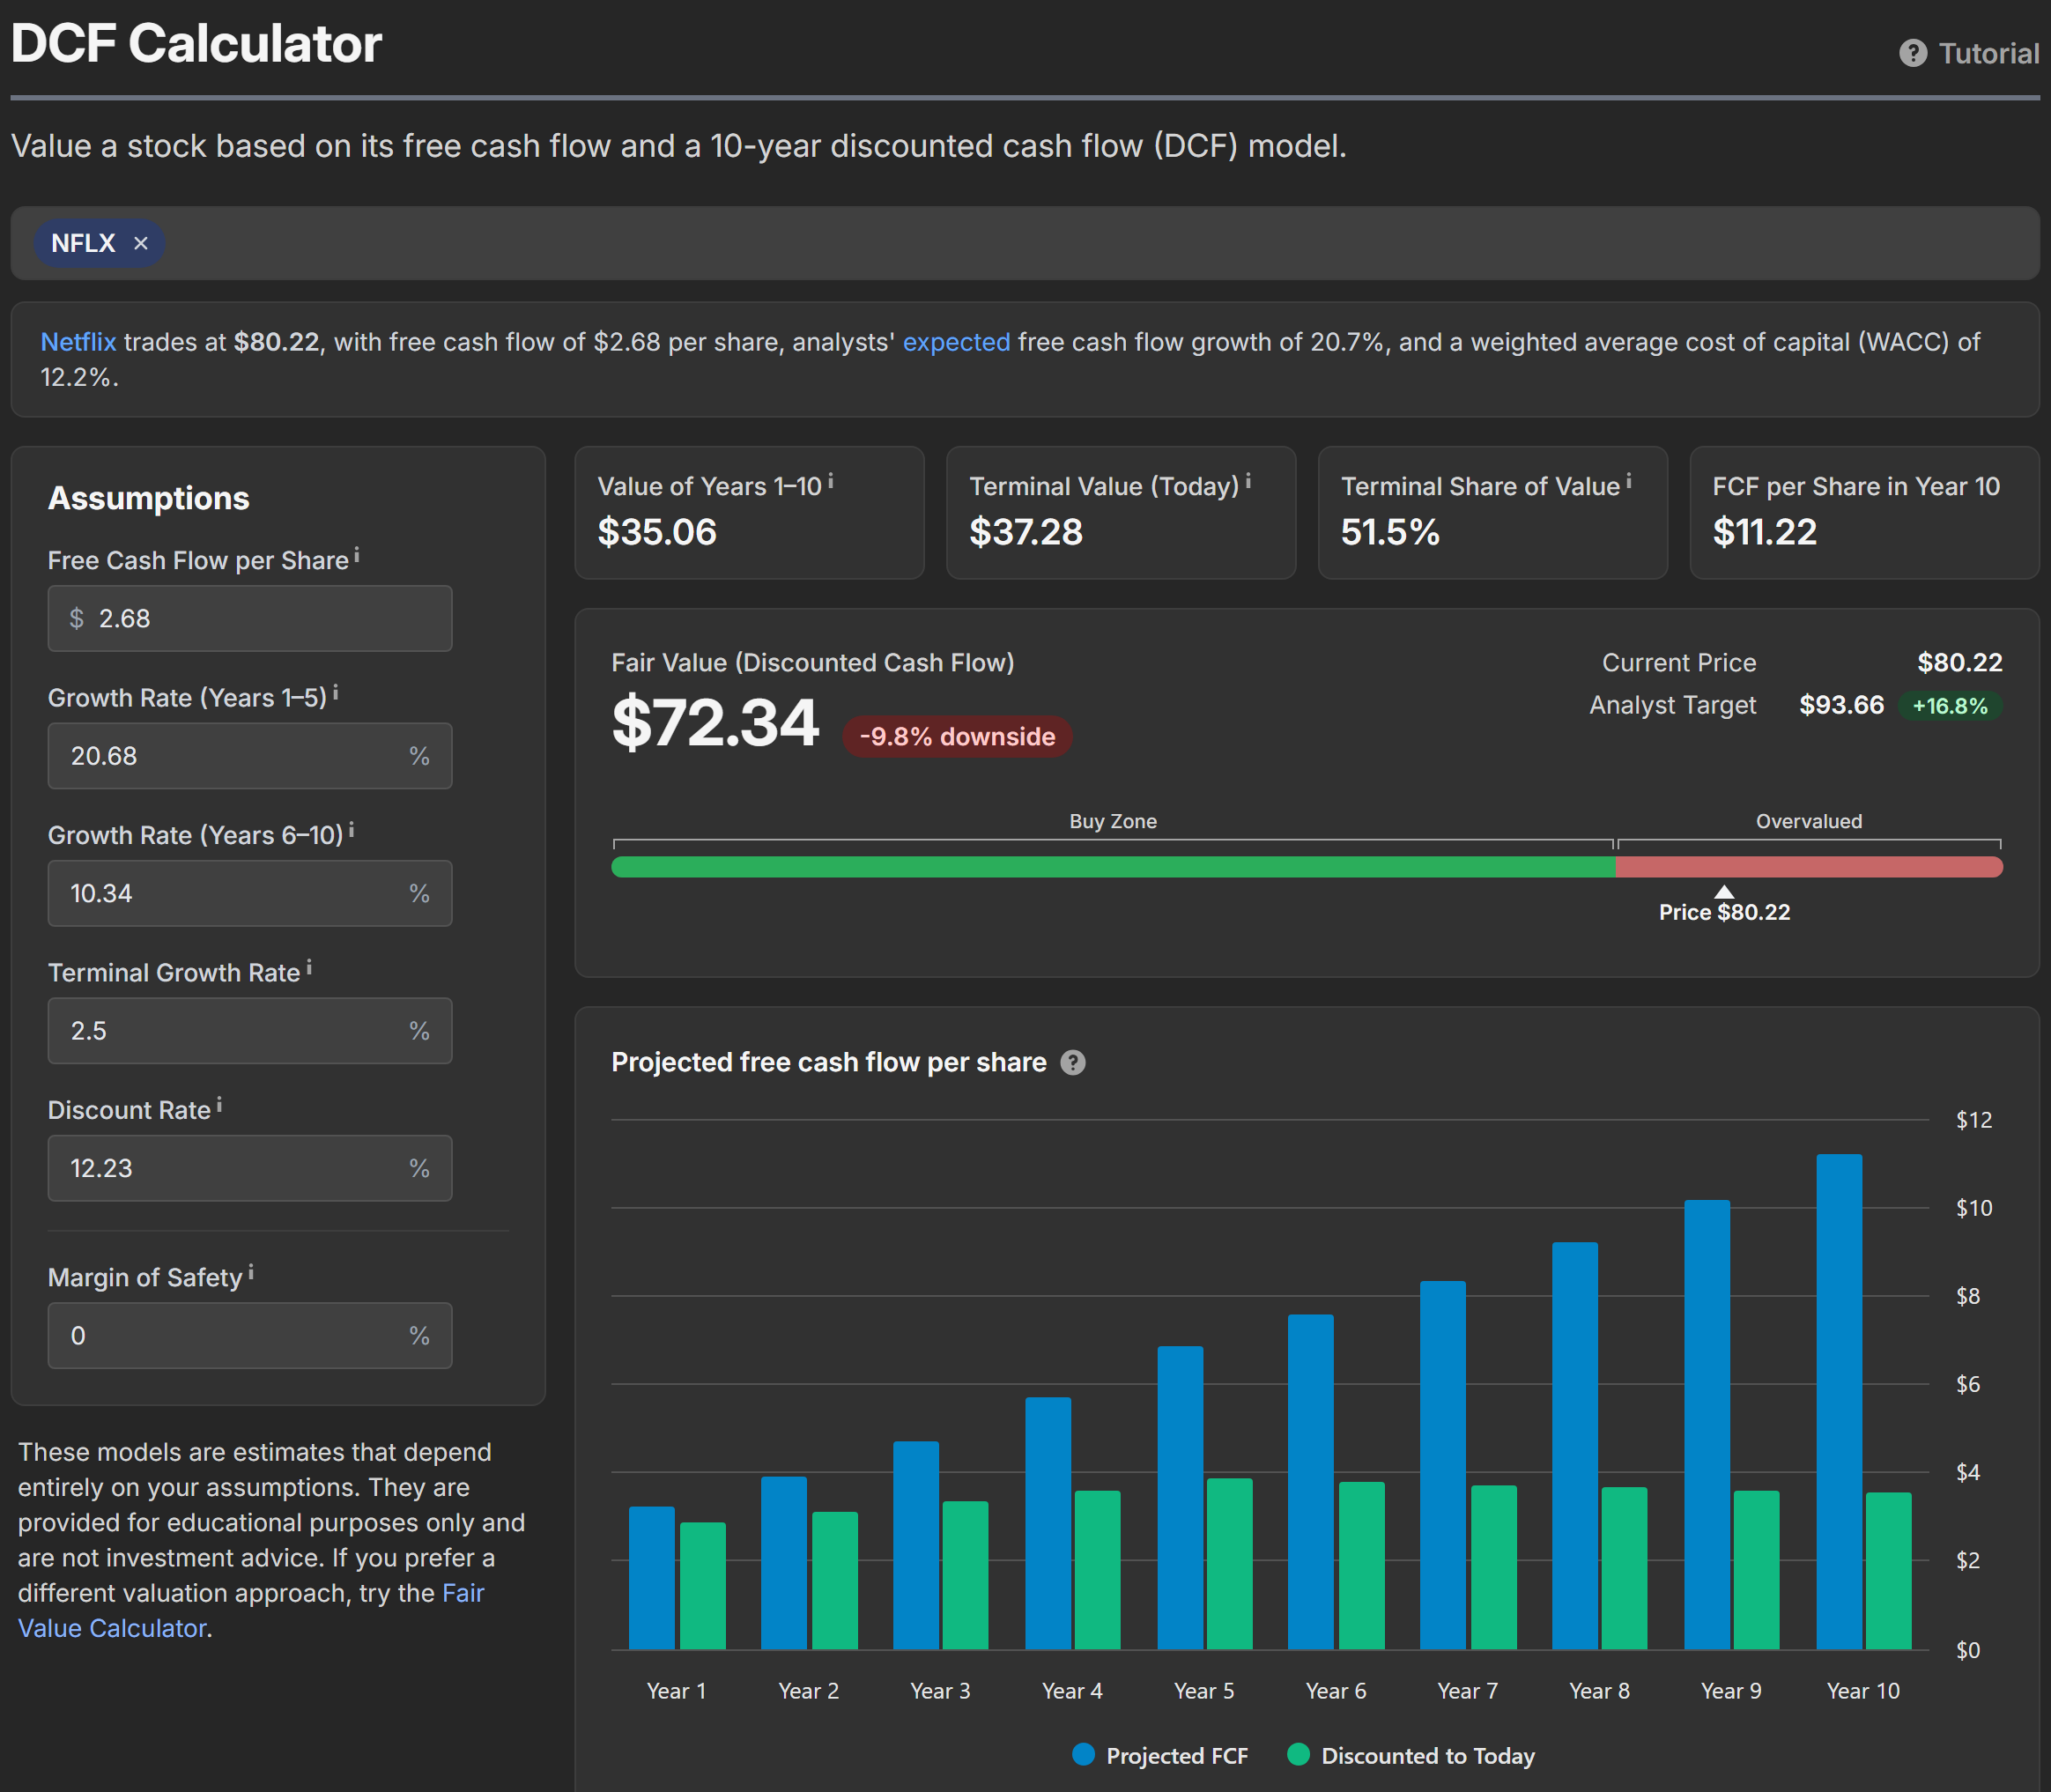
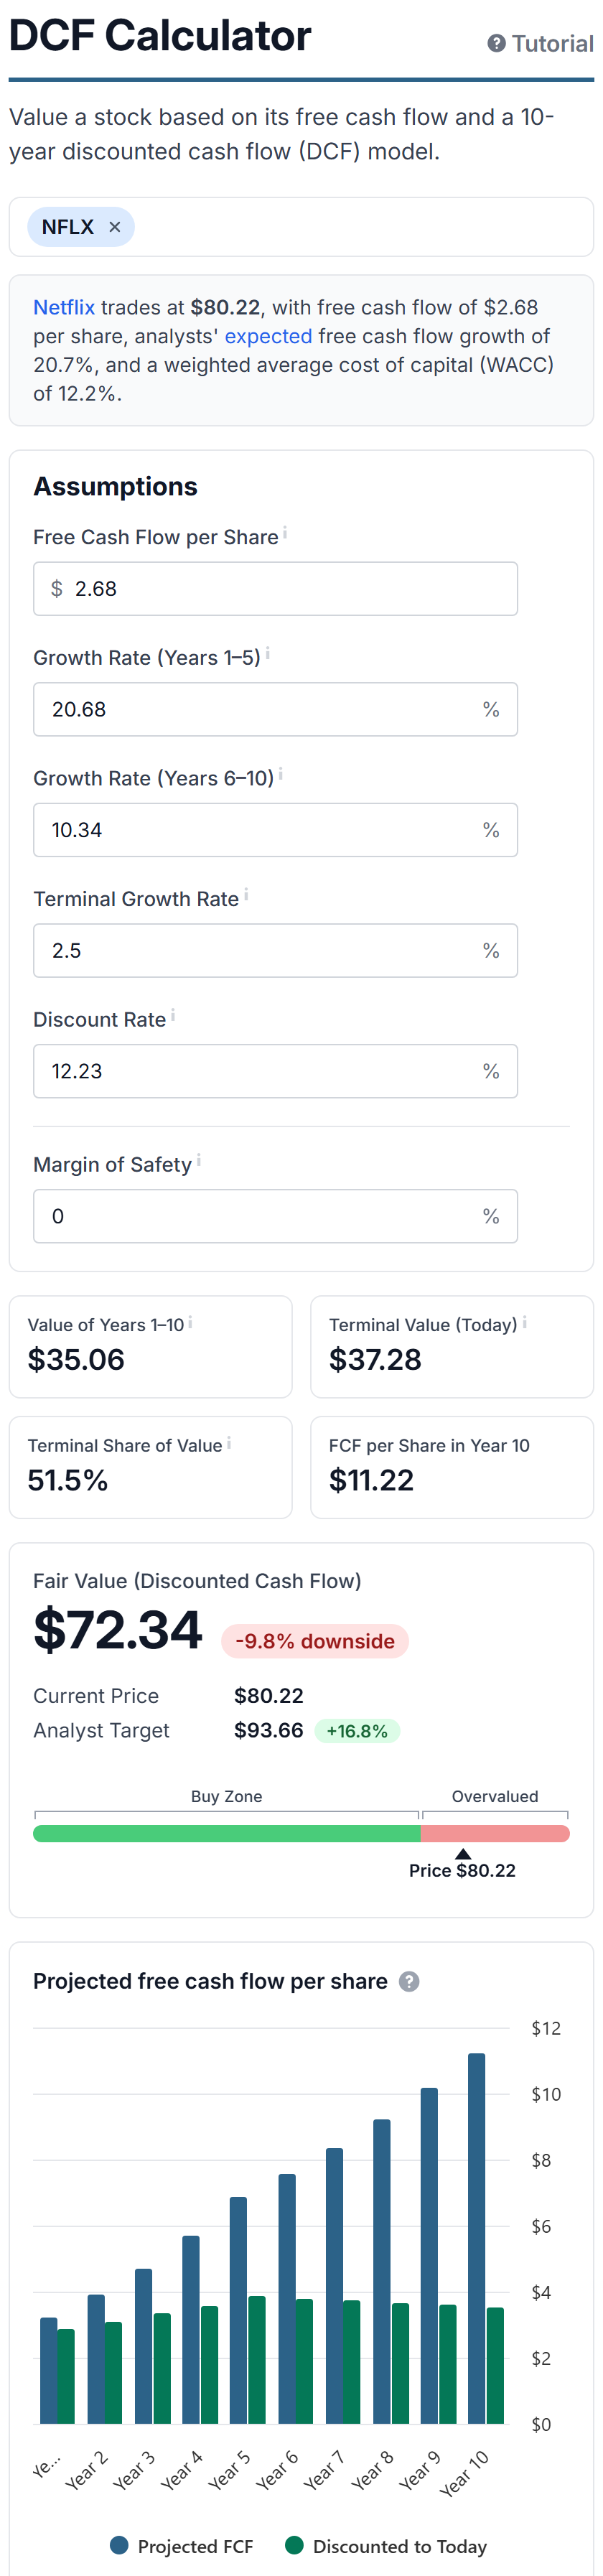
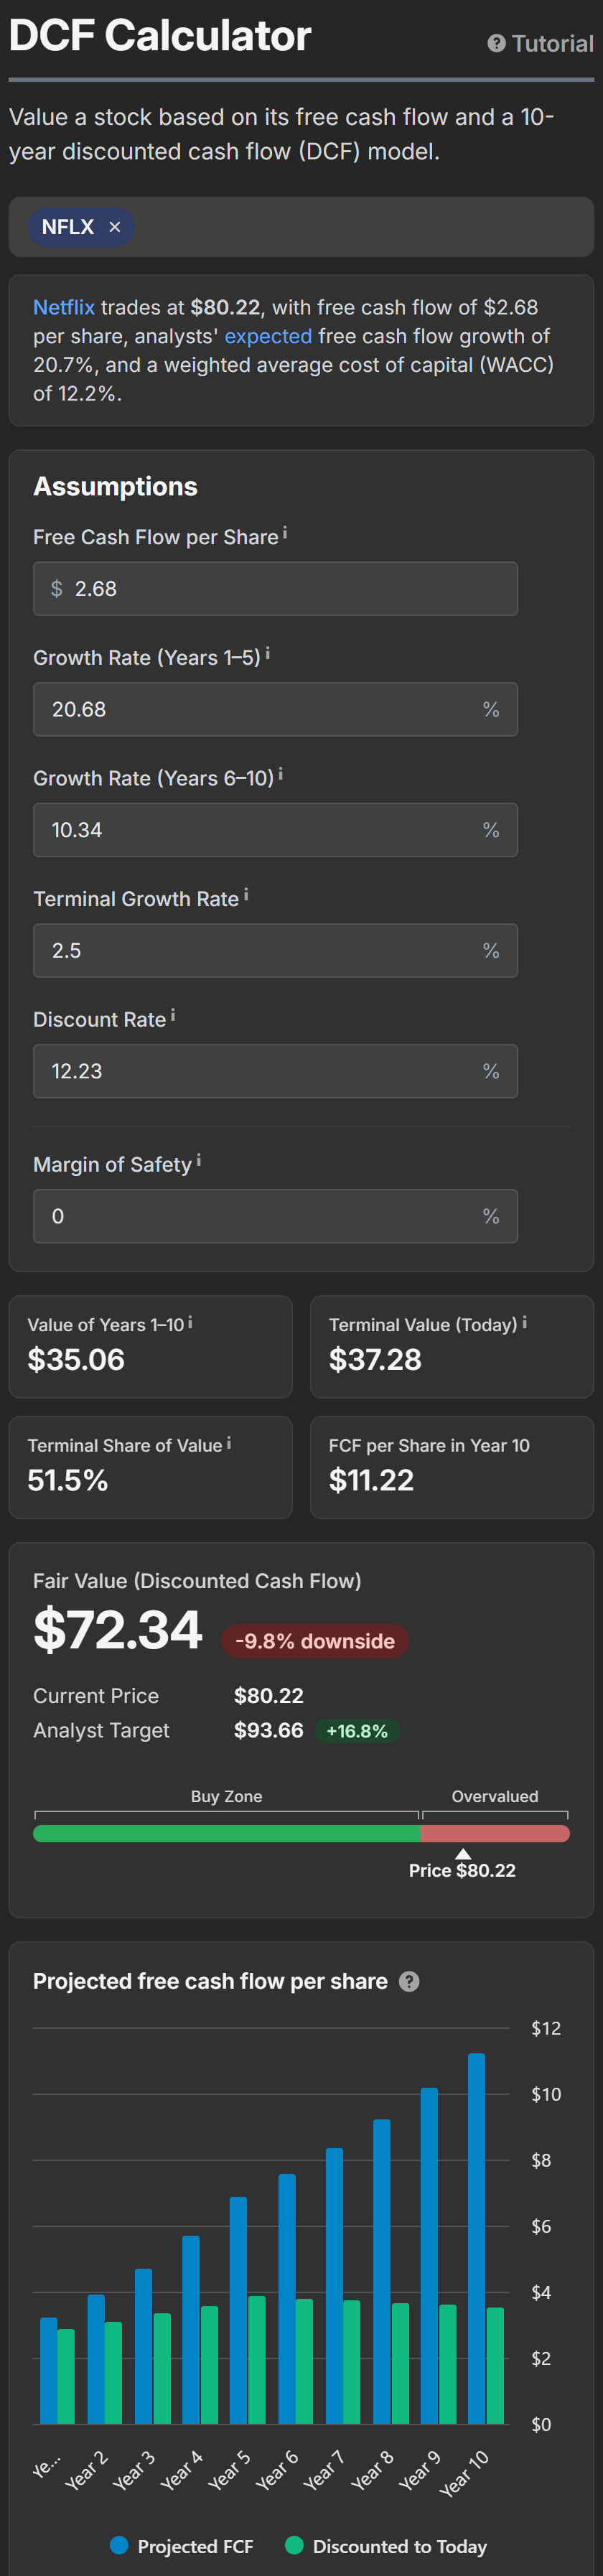
Type a company name or ticker symbol into the search box at the top and pick a result. The list only has stocks, since ETFs and funds have no free cash flow to value. The calculator fills in the stock's numbers, and a line under the search box tells you what it used: the current price, the free cash flow per share, analysts' expected free cash flow growth, and the weighted average cost of capital (WACC).


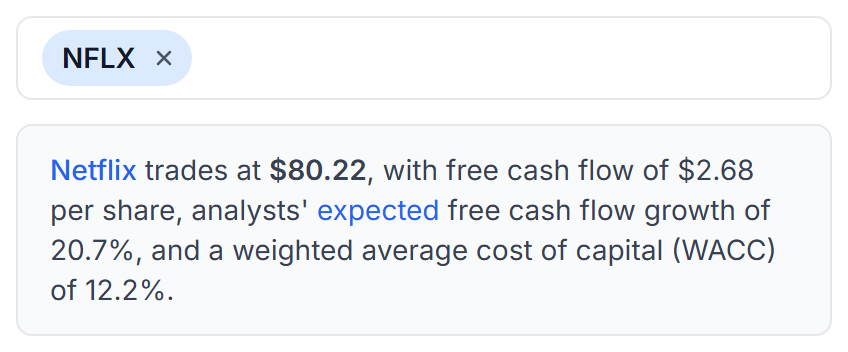
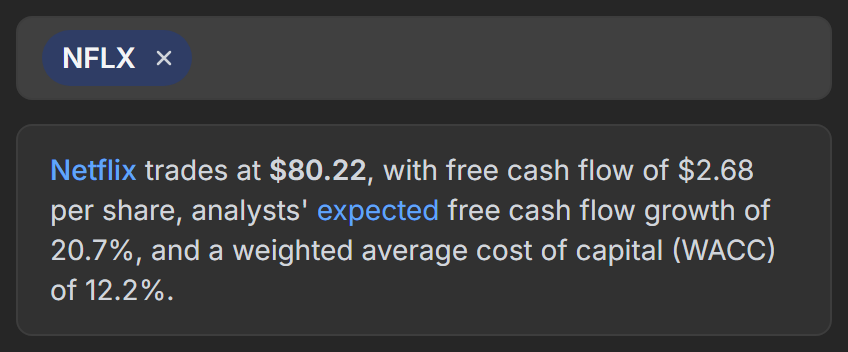
The word "expected" links to the stock's forecast page, where the analyst estimates come from. To switch stocks, clicktap the small x next to the ticker and search again. The stock also lives in the page address, so a link like the one below opens the calculator already filled in.
Set your assumptions
The Assumptions card holds the five numbers the model runs on. The fair value updates as you type. There's no Calculate button to press.
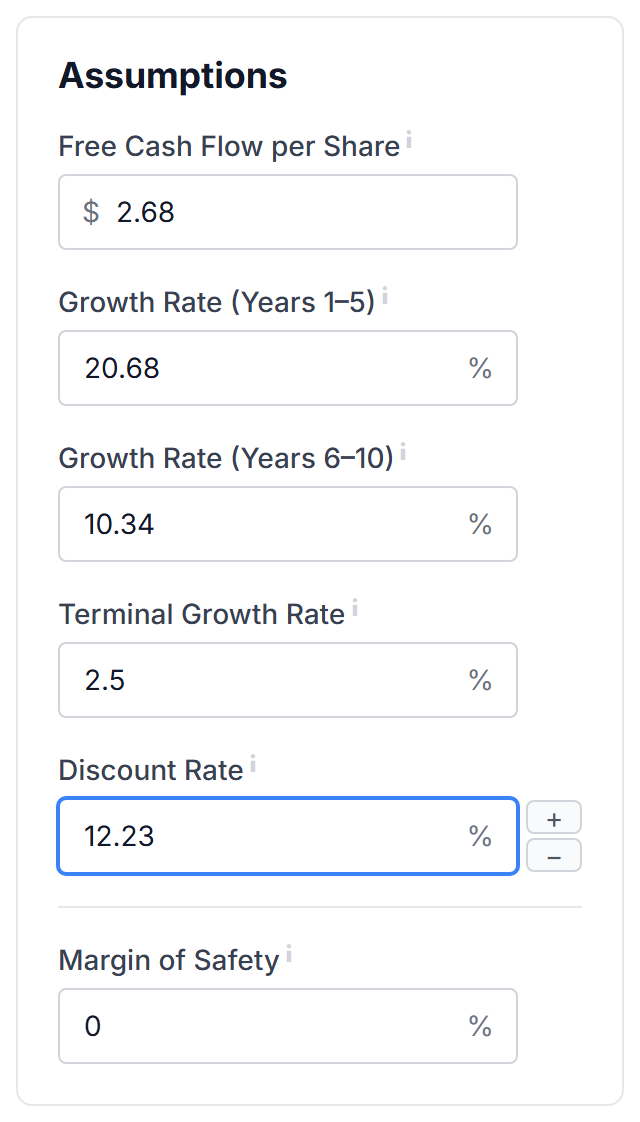
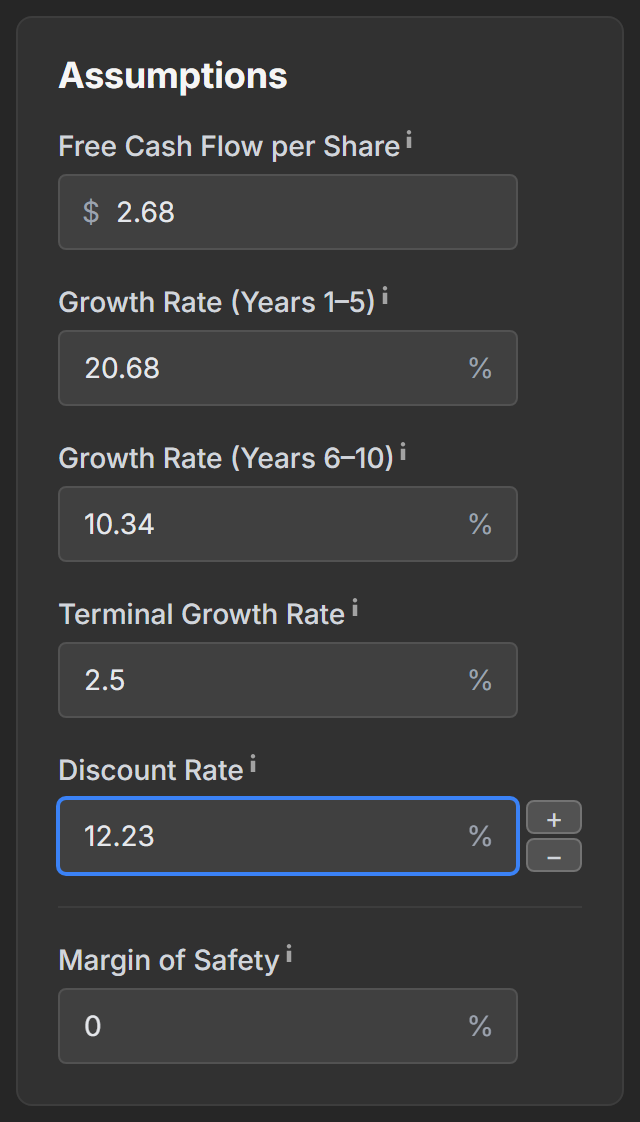
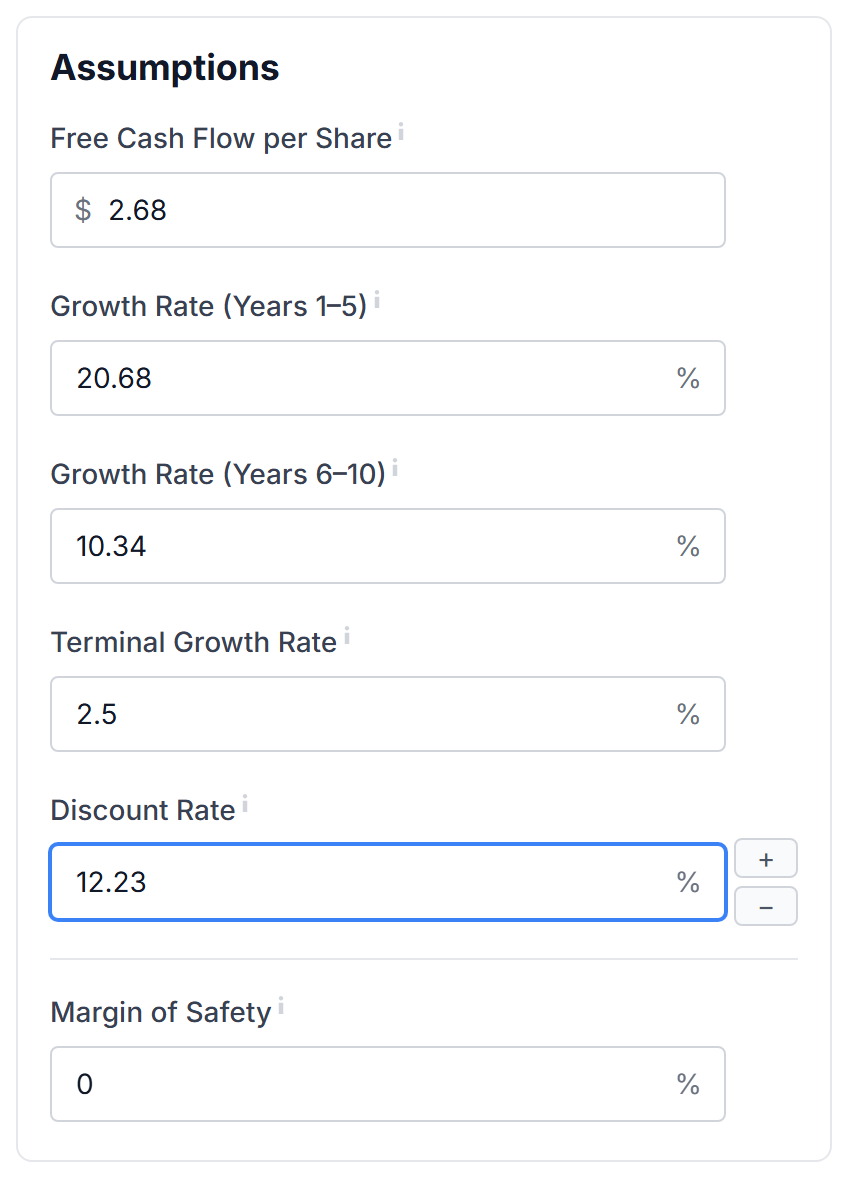
- Free Cash Flow per Share is the starting point: free cash flow over the last 12 months, divided by the shares outstanding.
- Growth Rate (Years 1–5) is how fast that cash flow grows at first. It starts from analysts' free cash flow estimates for the next three years when they exist, and from expected EPS growth when they don't.
- Growth Rate (Years 6–10) is the slower rate for the second half. It starts at half of the first rate, since most companies cool off as they get bigger.
- Terminal Growth Rate is the growth assumed forever after year 10. It starts at 2.5%. Keep it near long-run economic growth, because a company can't outgrow the economy forever.
- Discount Rate is the yearly return you require. It starts from the company's WACC, kept between 6% and 15%. A higher rate gives a lower fair value.
Hover overTap the small i next to any label to see what the field means and where its starting value came from. If a value was capped, or a fallback was used, the note says so.
Hover over a field and two small buttons appear beside it, + and −. They step to round numbers first, so a discount rate of 12.23% goes to 12.5%, then 13%.
Tap a field and two small buttons appear beside it, + and −. They step to round numbers first, so a discount rate of 12.23% goes to 12.5%, then 13%. It saves you from retyping on a phone keyboard.
Your changes are kept in the page address as you make them. Bookmark the page or copy the link, and it opens with the same stock and the same numbers. Only the fields you changed are added, so the rest still follow the latest data.
Read the fair value
The large number is the fair value per share. The pill beside it compares that to the current price: green with "upside" when the fair value is higher, red with "downside" when it's lower.
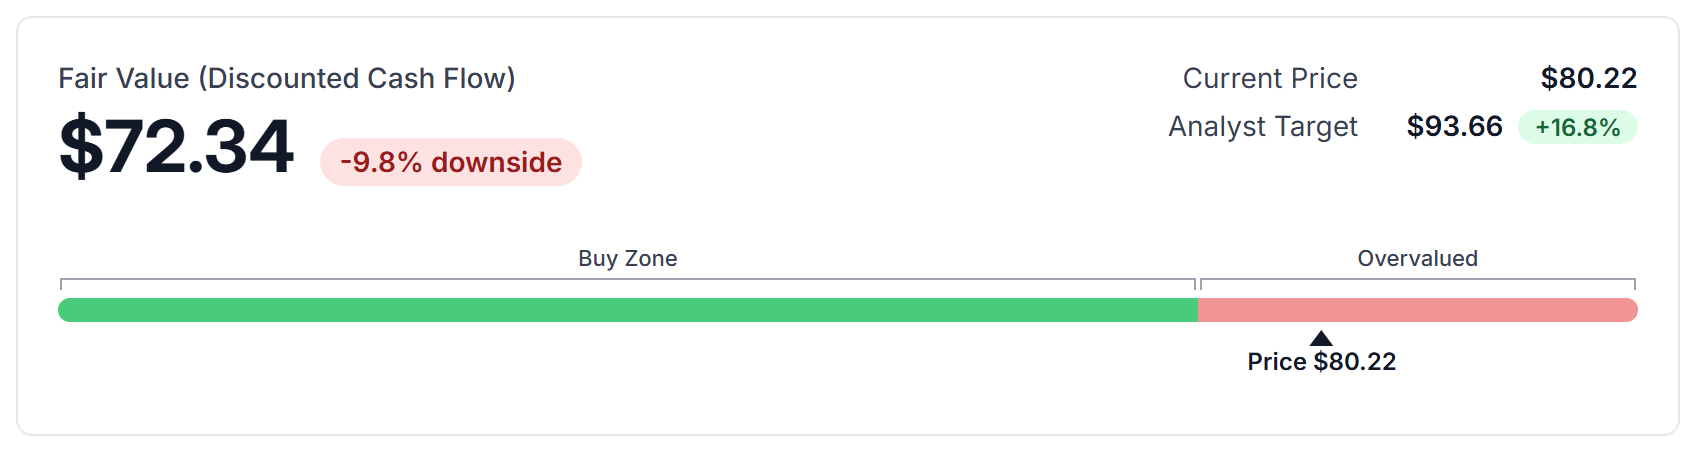
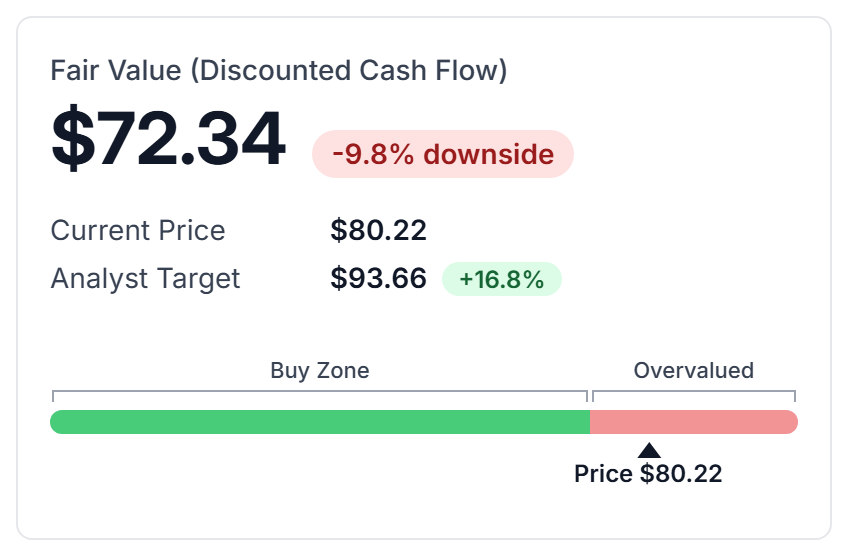
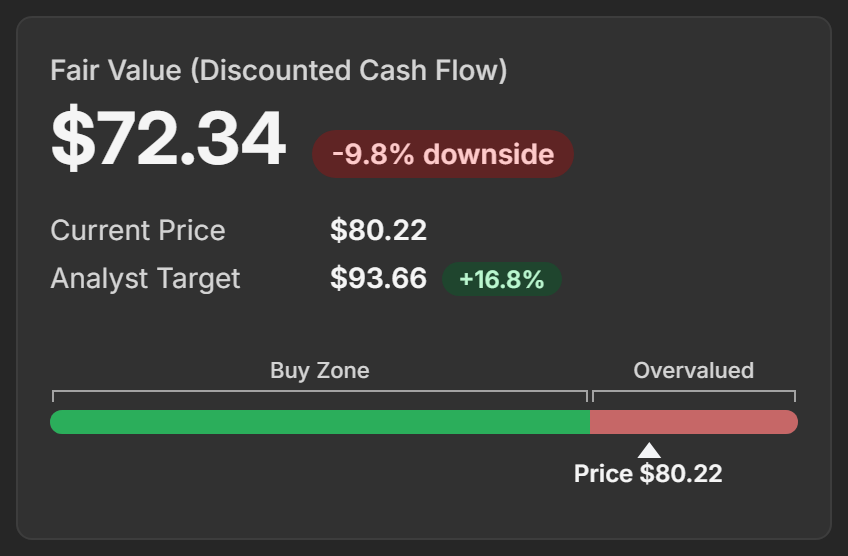
On the right you'll find the Current Price and, when analysts cover the stock, the Analyst Target with its own pill. The target isn't part of the calculation. It's there for comparison.
The bar underneath puts it all on one scale. The green Buy Zone runs up to the fair value, the red Overvalued zone sits above it, and the marker shows where the price is today.
Add a margin of safety
A margin of safety cuts the fair value by a percentage you choose, to leave room for being wrong. It starts at 0%, which leaves the fair value untouched.
Set it to 20% and the headline becomes "Fair Value With 20% Margin of Safety" with the reduced figure. A Fair Value row appears on the right so the original number stays in view, and an amber Margin of Safety zone opens up on the bar.
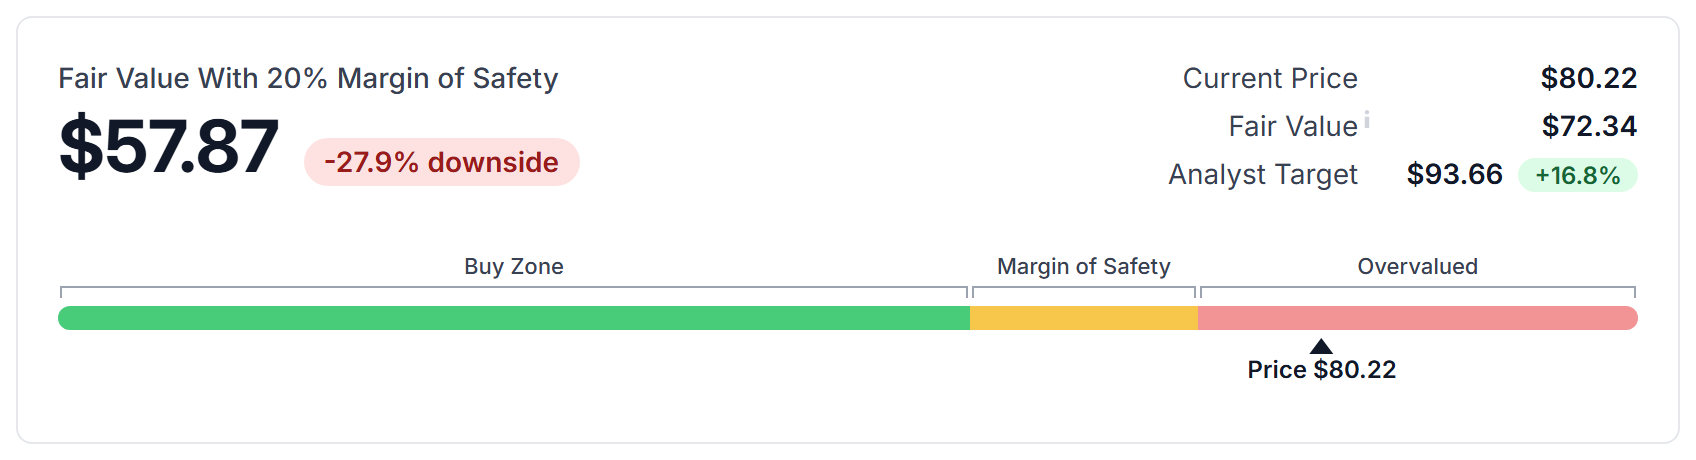
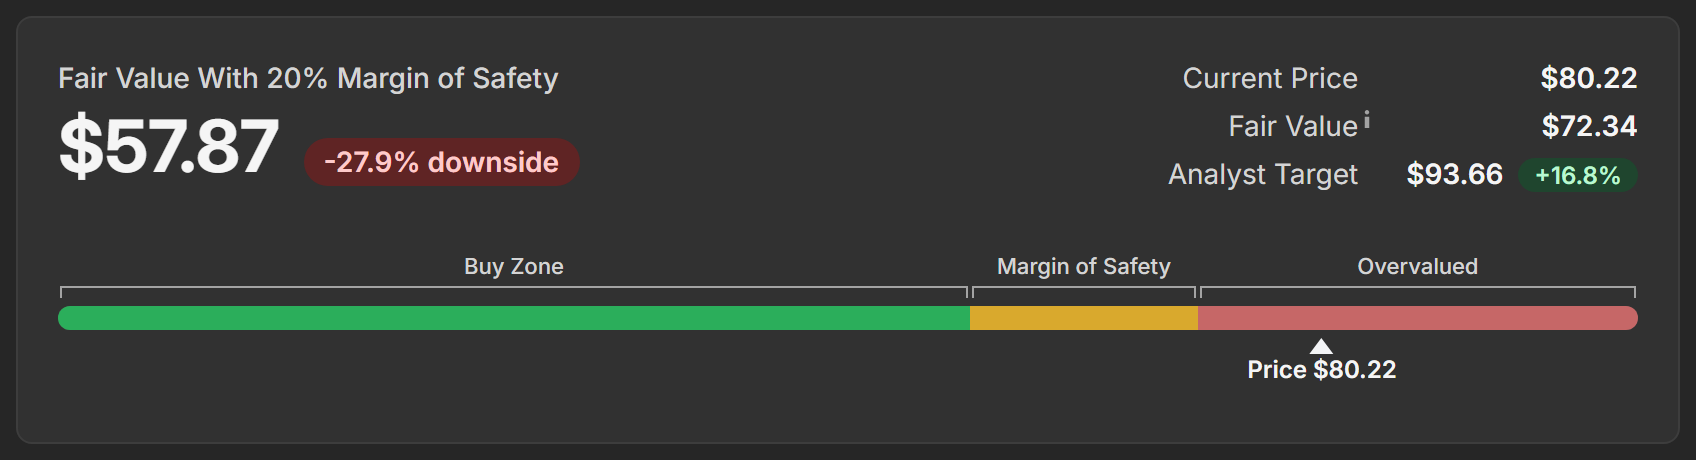
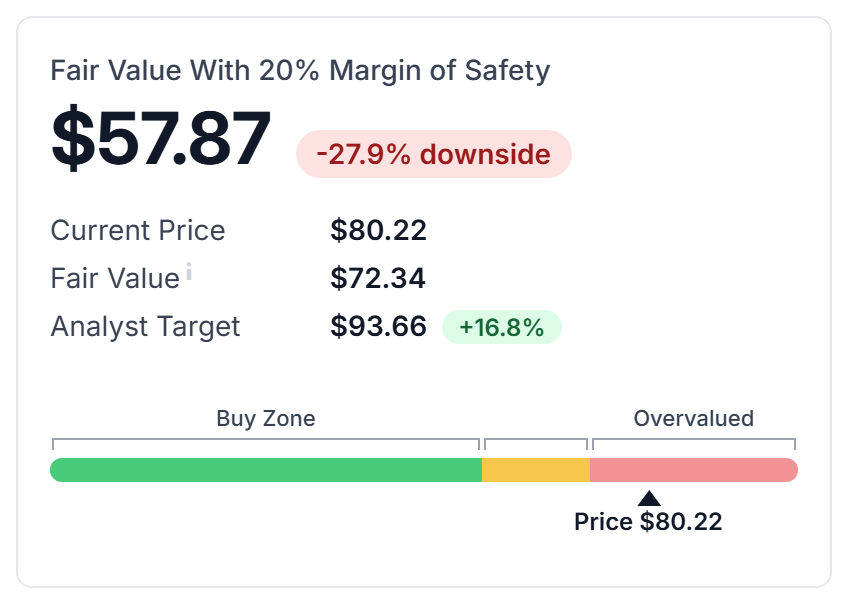
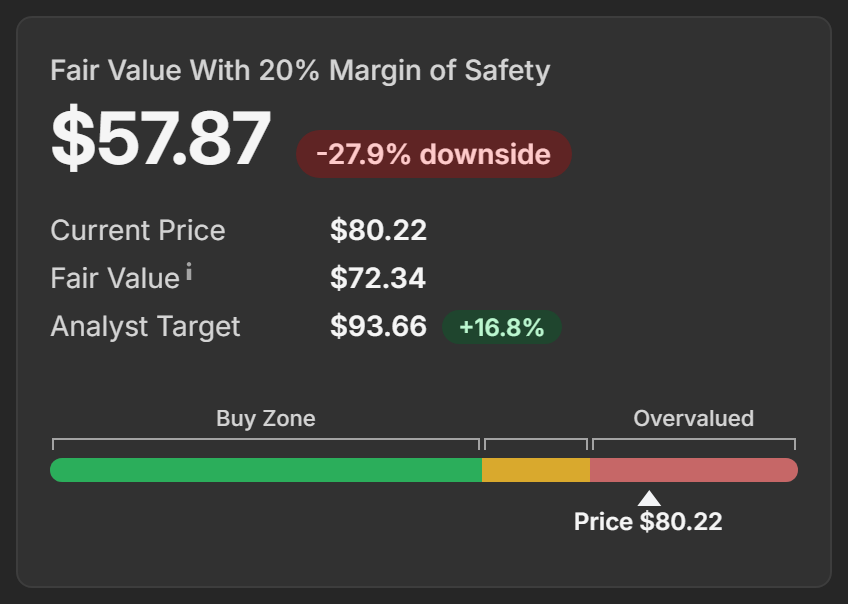
Keep in mind that the upside or downside pill now measures against the reduced figure, and the sensitivity table follows along too.
Where the value comes from
Four boxes at the top of the results split the fair value into its parts:


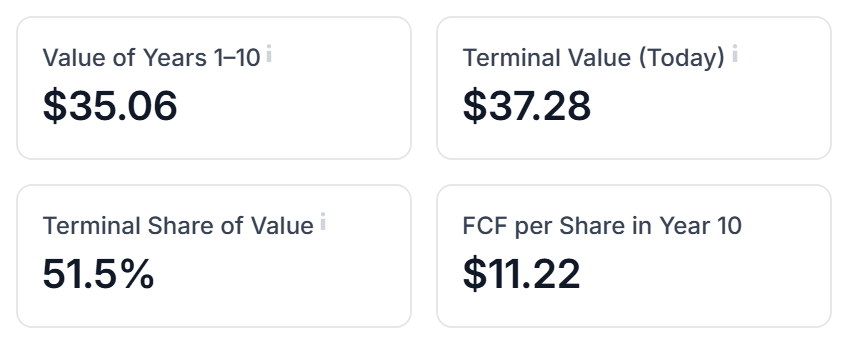
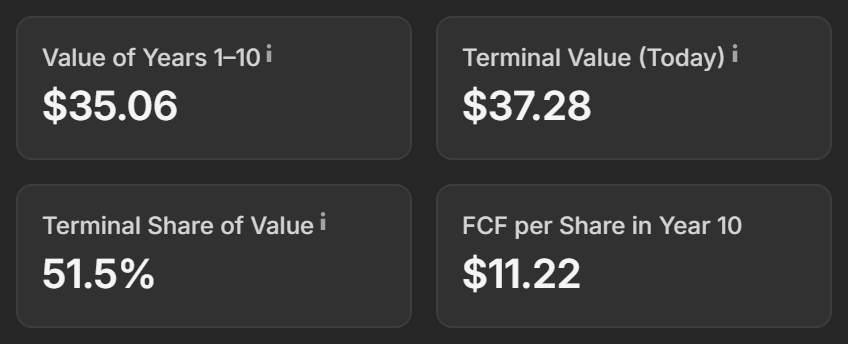
- Value of Years 1–10 is the next ten years of cash flow, each year discounted to today and added up.
- Terminal Value (Today) is everything after year 10, also discounted to today. The two add up to the fair value.
- Terminal Share of Value is how much of the fair value comes from that distant future. Above 75%, the answer leans heavily on the terminal growth rate and the discount rate, so treat it with extra caution.
- FCF per Share in Year 10 is where the cash flow ends up after both growth periods.
Follow the cash flows
The chart shows two bars for each year. The blue bar is the projected free cash flow per share. The green bar is the same cash flow after discounting, which is what that year is worth today.
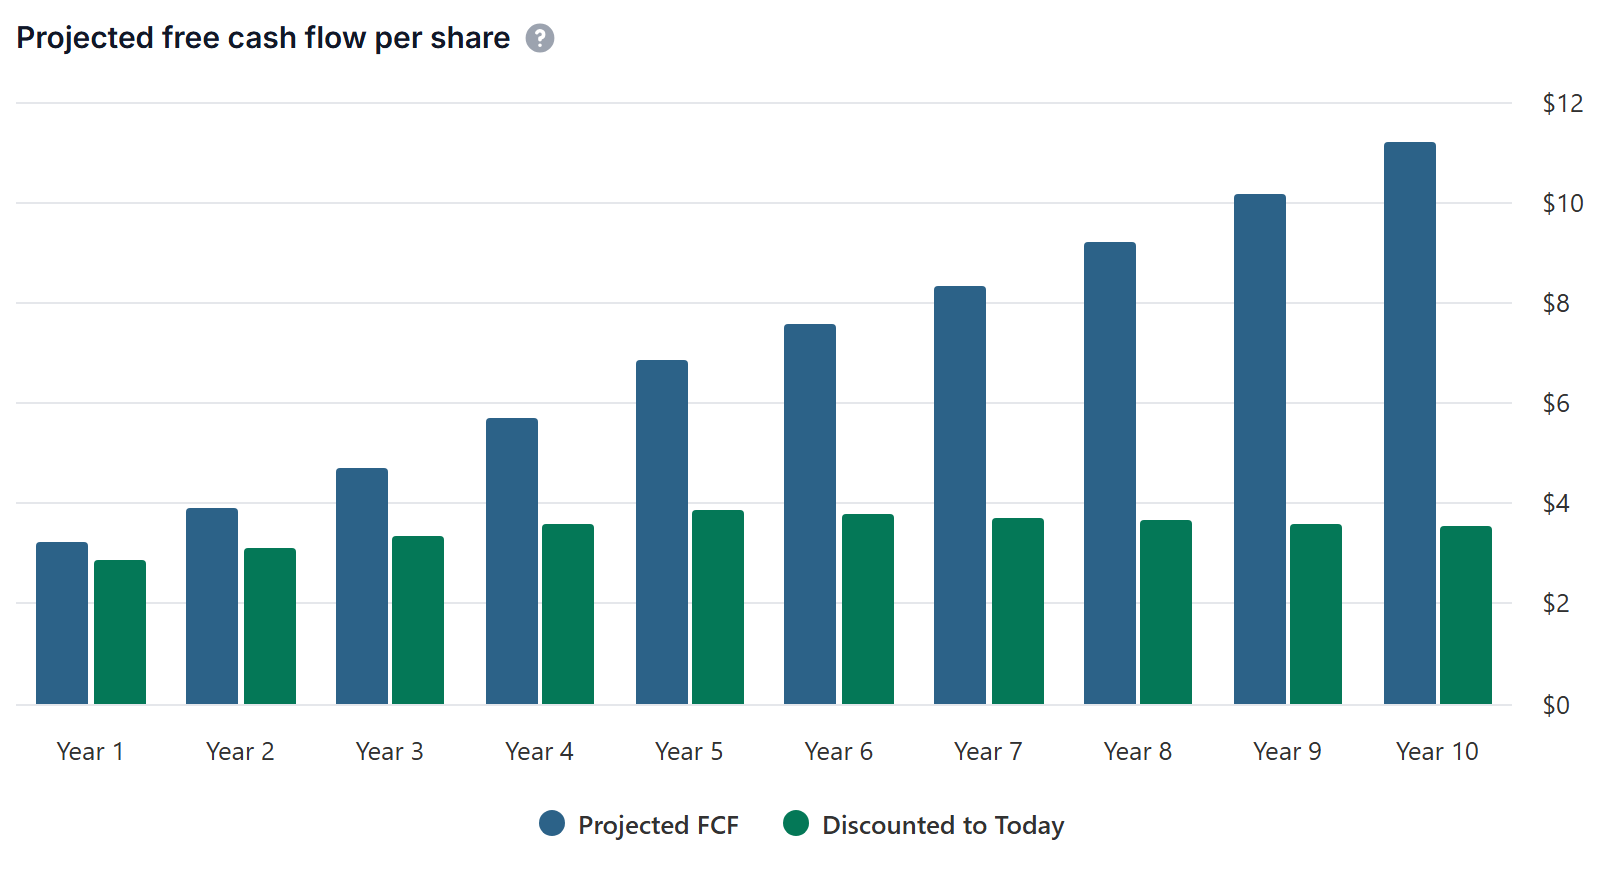
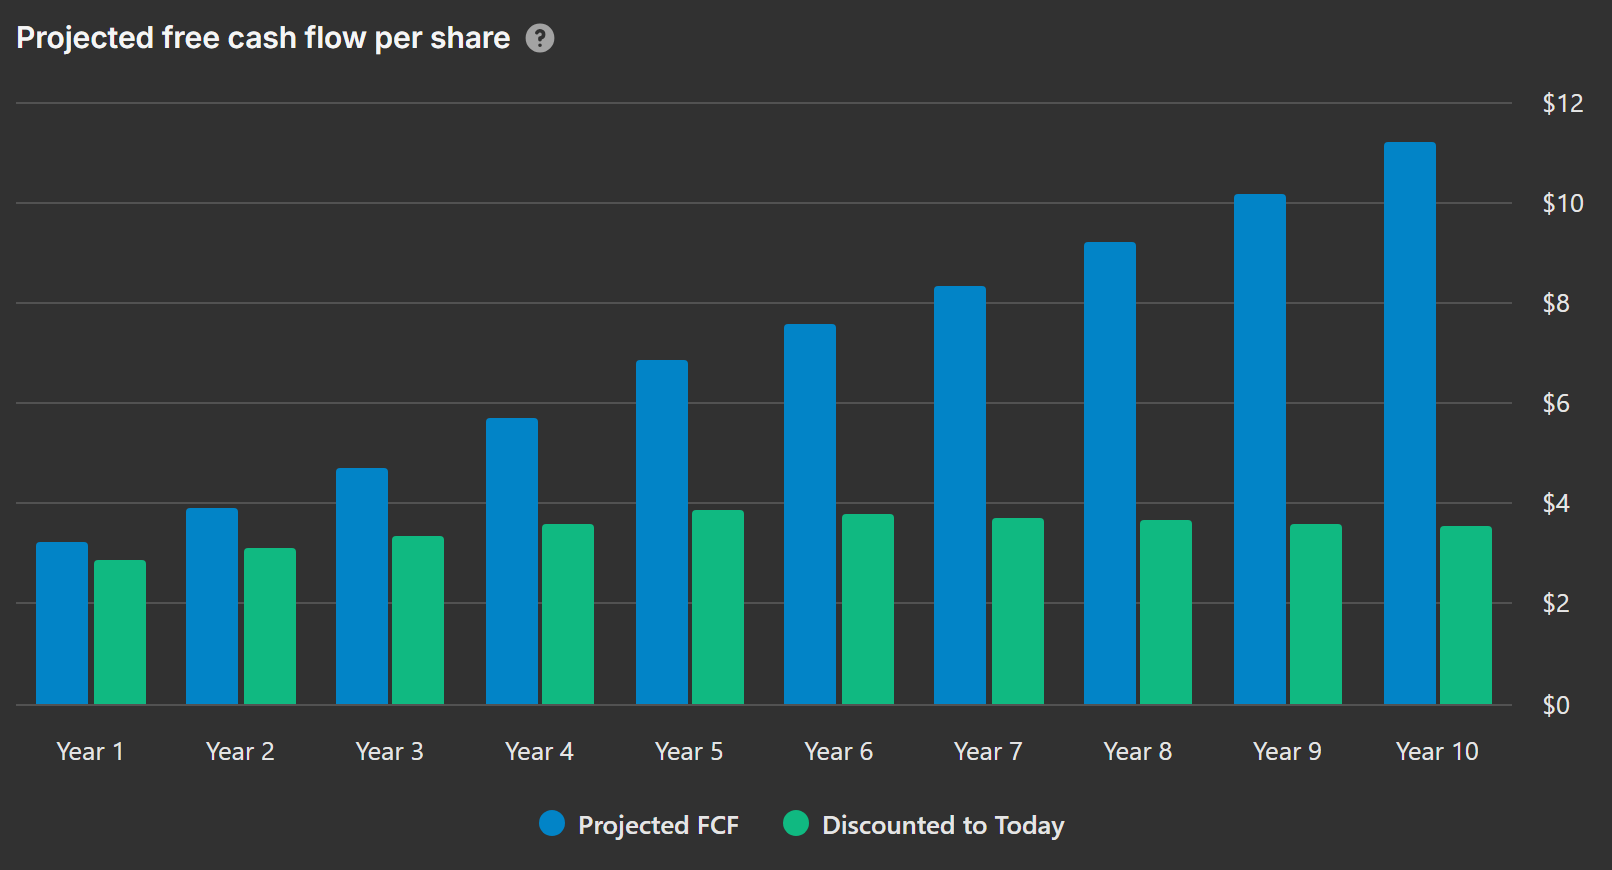
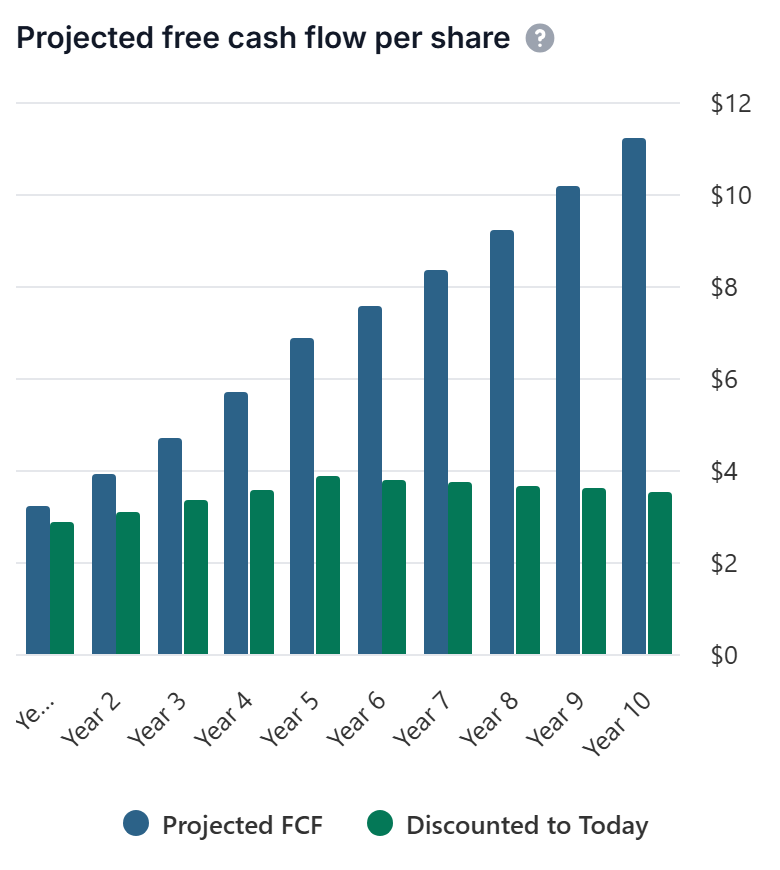
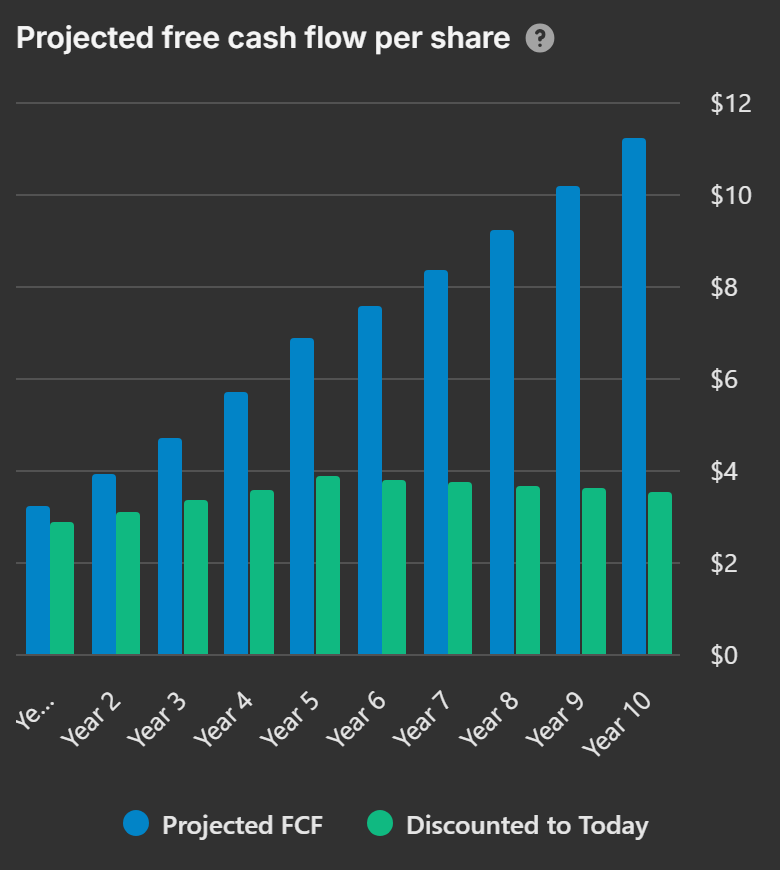
Notice how the gap between the two widens over time. The projected bars keep growing, but the discounted ones often flatten or shrink, because a cash flow ten years away gets discounted ten times. Hover overTap any year to see both values. The question mark next to the chart title has a short reminder of how to read it.
Test your assumptions
The table below the chart covers the two inputs a DCF is most sensitive to. Each row is a different discount rate, each column a different terminal growth rate, and each cell is the fair value for that pair.
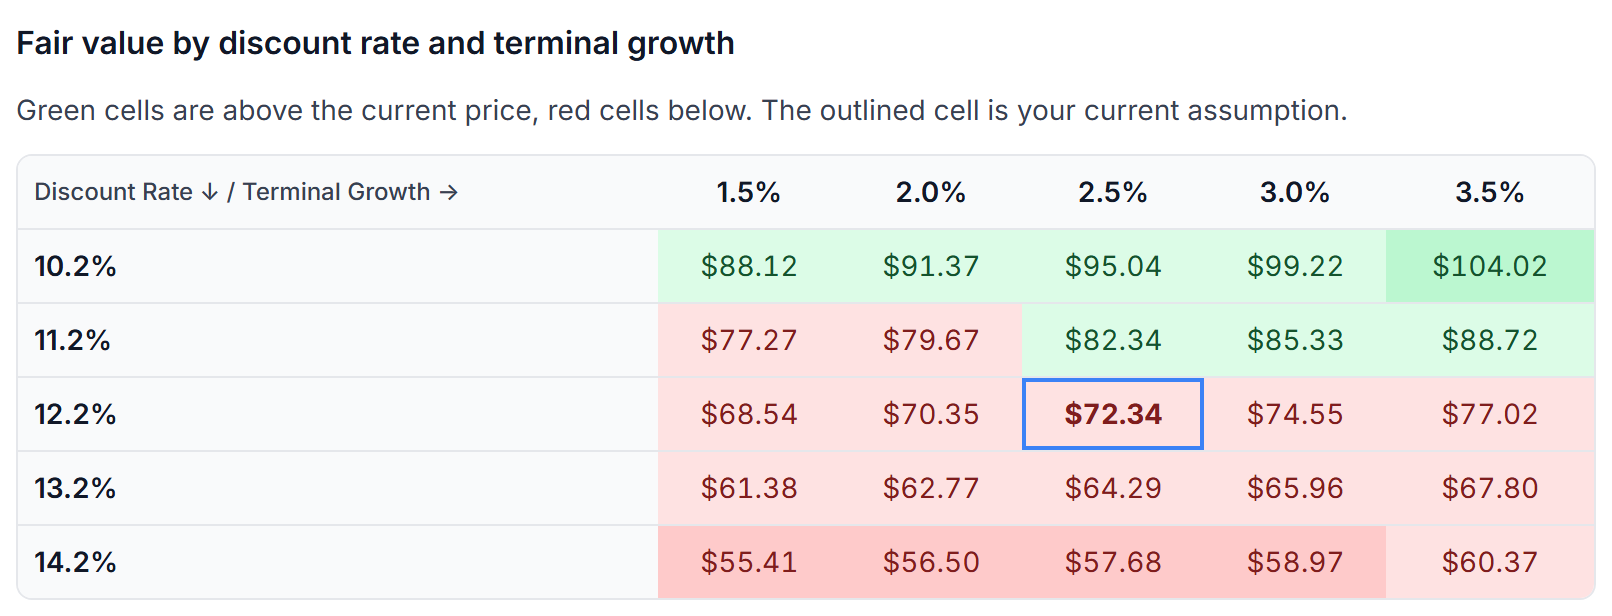
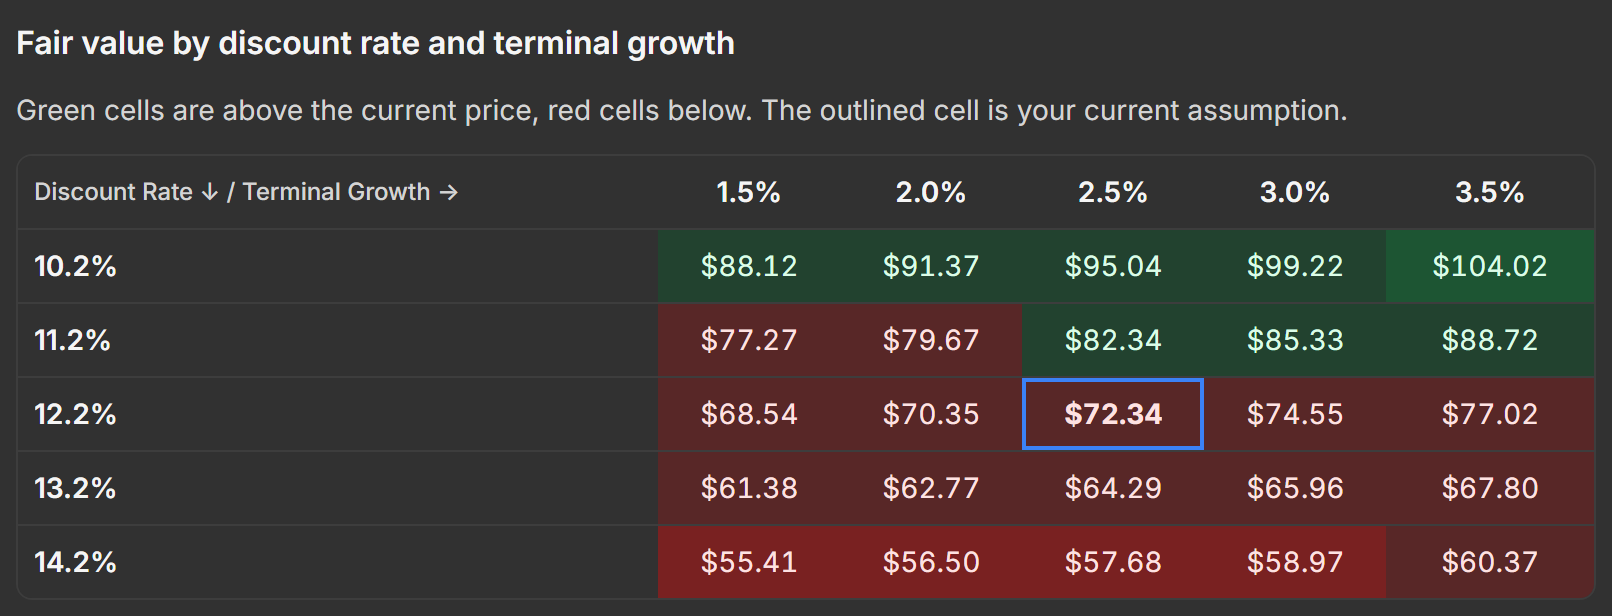
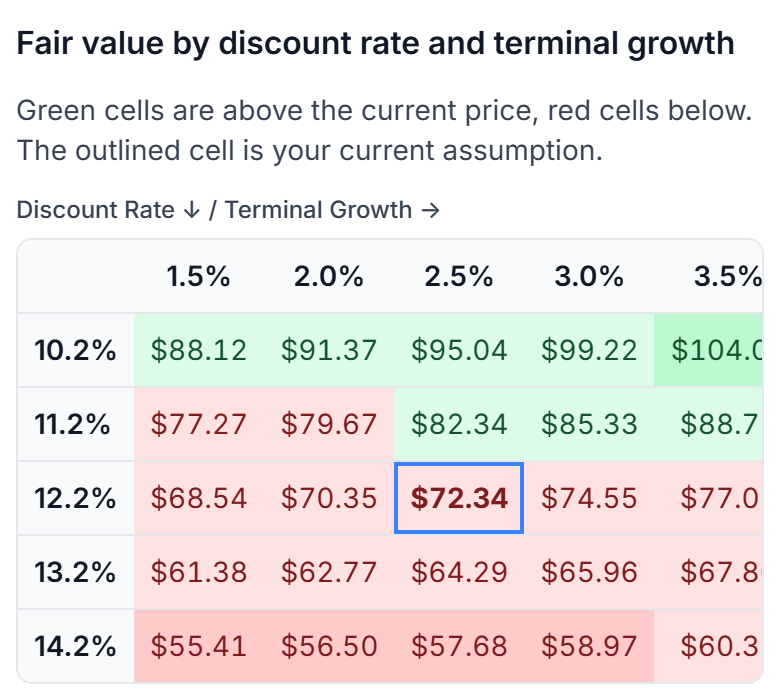
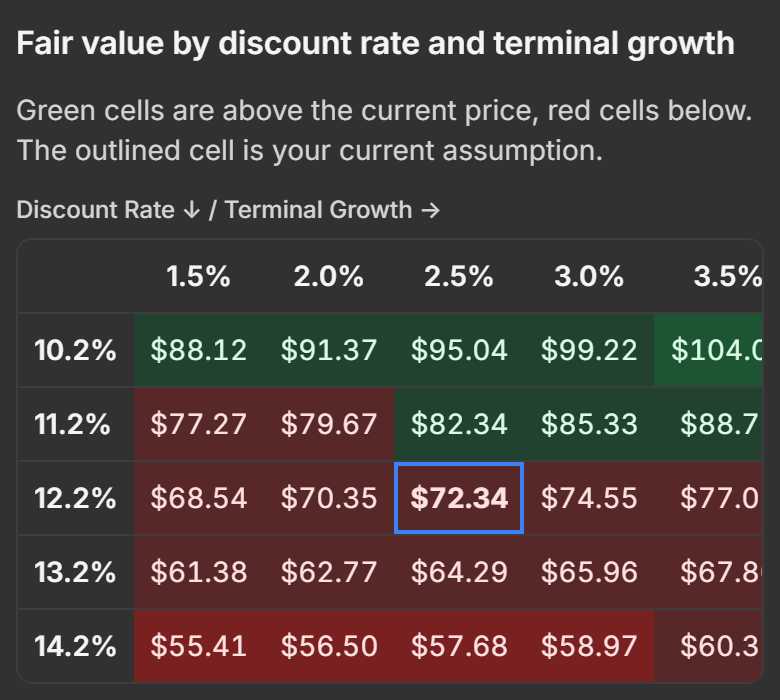
The outlined cell in the middle is your current assumption, so it always matches the headline. Green cells are above the current price and red cells below. One percentage point on the discount rate often moves the fair value by 15% or more, which is a good reason to look at the whole table instead of a single number.
When a DCF fits poorly
A DCF based on today's cash flow assumes that cash flow is a fair picture of the business. Sometimes it isn't. A company in the middle of a heavy investment phase can have analysts expecting its free cash flow to turn negative for a few years, even while its earnings keep growing.
When that's the case, an amber Heads up badge appears next to the Assumptions title. Hover overTap it for the explanation. The calculator also stops using the cash flow forecast for the growth rate and uses expected EPS growth instead.
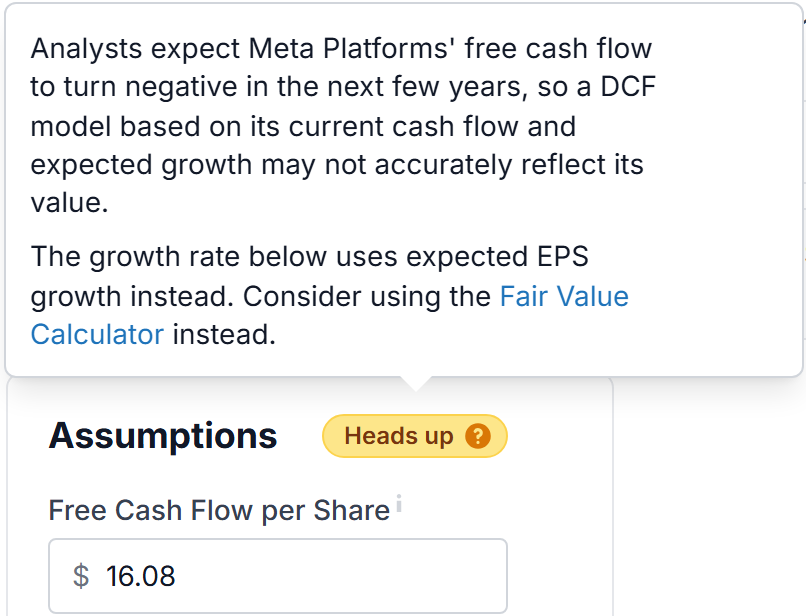
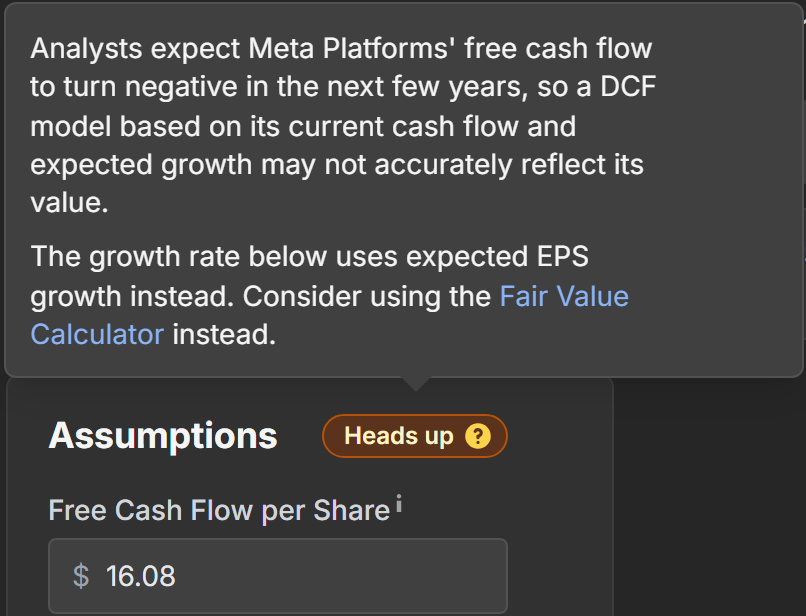
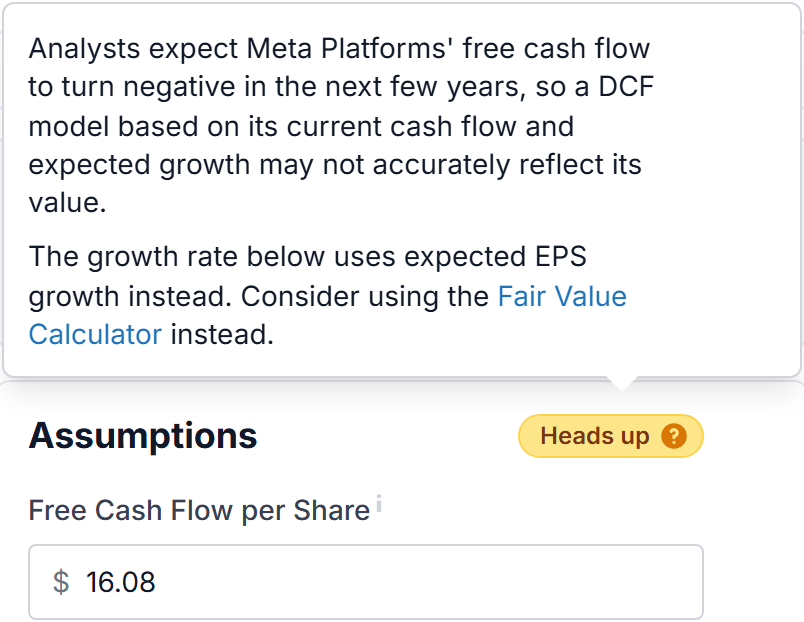
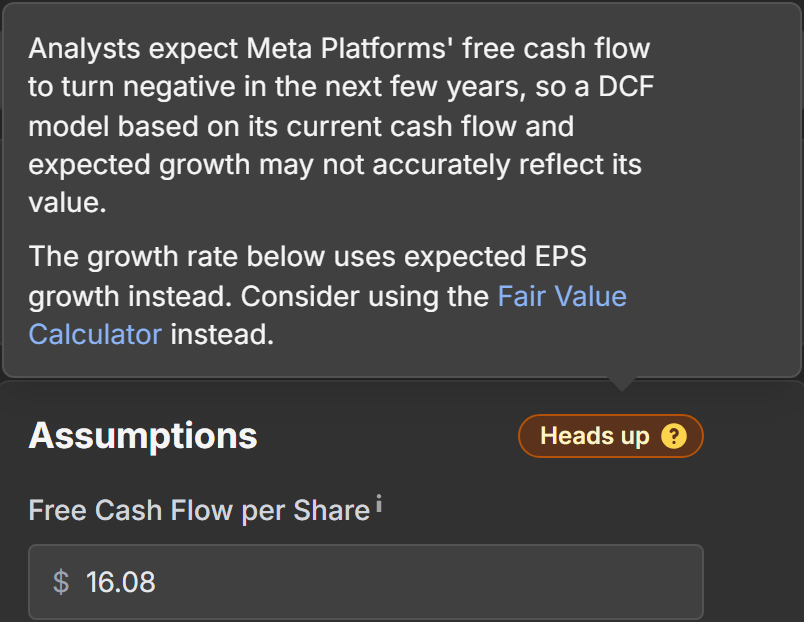
The badge links to the Fair Value Calculator with the same stock loaded. It values the company on earnings instead, which usually suits these cases better.
Use your own numbers
You don't have to pick a stock. With the search box empty, the calculator shows a made-up company and adds a Current Stock Price field at the top of the Assumptions card. Fill in the price and the rest, and it works the same way.
A few finishing tips
- The method needs positive free cash flow. If a company is burning cash, the calculator says so and shows no fair value.
- The discount rate must be higher than the terminal growth rate. If it isn't, the formula breaks down and the calculator tells you.
- Banks and insurers don't have a meaningful free cash flow, so a DCF rarely suits them. The Fair Value Calculator is the better fit there.