
Fund Holdings Overlap Tutorial
The Fund Holdings Overlap tool answers a simple question: when you own two funds, how much of your money is in the same stocks twice? Pick any two ETFs or mutual funds and it compares their complete holdings lists, not just the top ten.
You get the overlap as a single percentage, every holding the funds share, the holdings only one of them owns, their sector and country exposure side by side, and a combined view of what you'd actually hold if you bought both. Add up to eight funds to check a whole portfolio at once.
Everything in this tutorial works on a free account. A few extras are part of Stock Analysis Pro and are marked as such along the way.
On this page
Pick two funds
Type a fund name or ticker into the search box at the top. Results appear as you type, and the search matches both, so "invesco" and "QQQ" both get you there. Only funds show up here: ETFs, mutual funds, closed-end funds and ETNs. Stocks are filtered out.
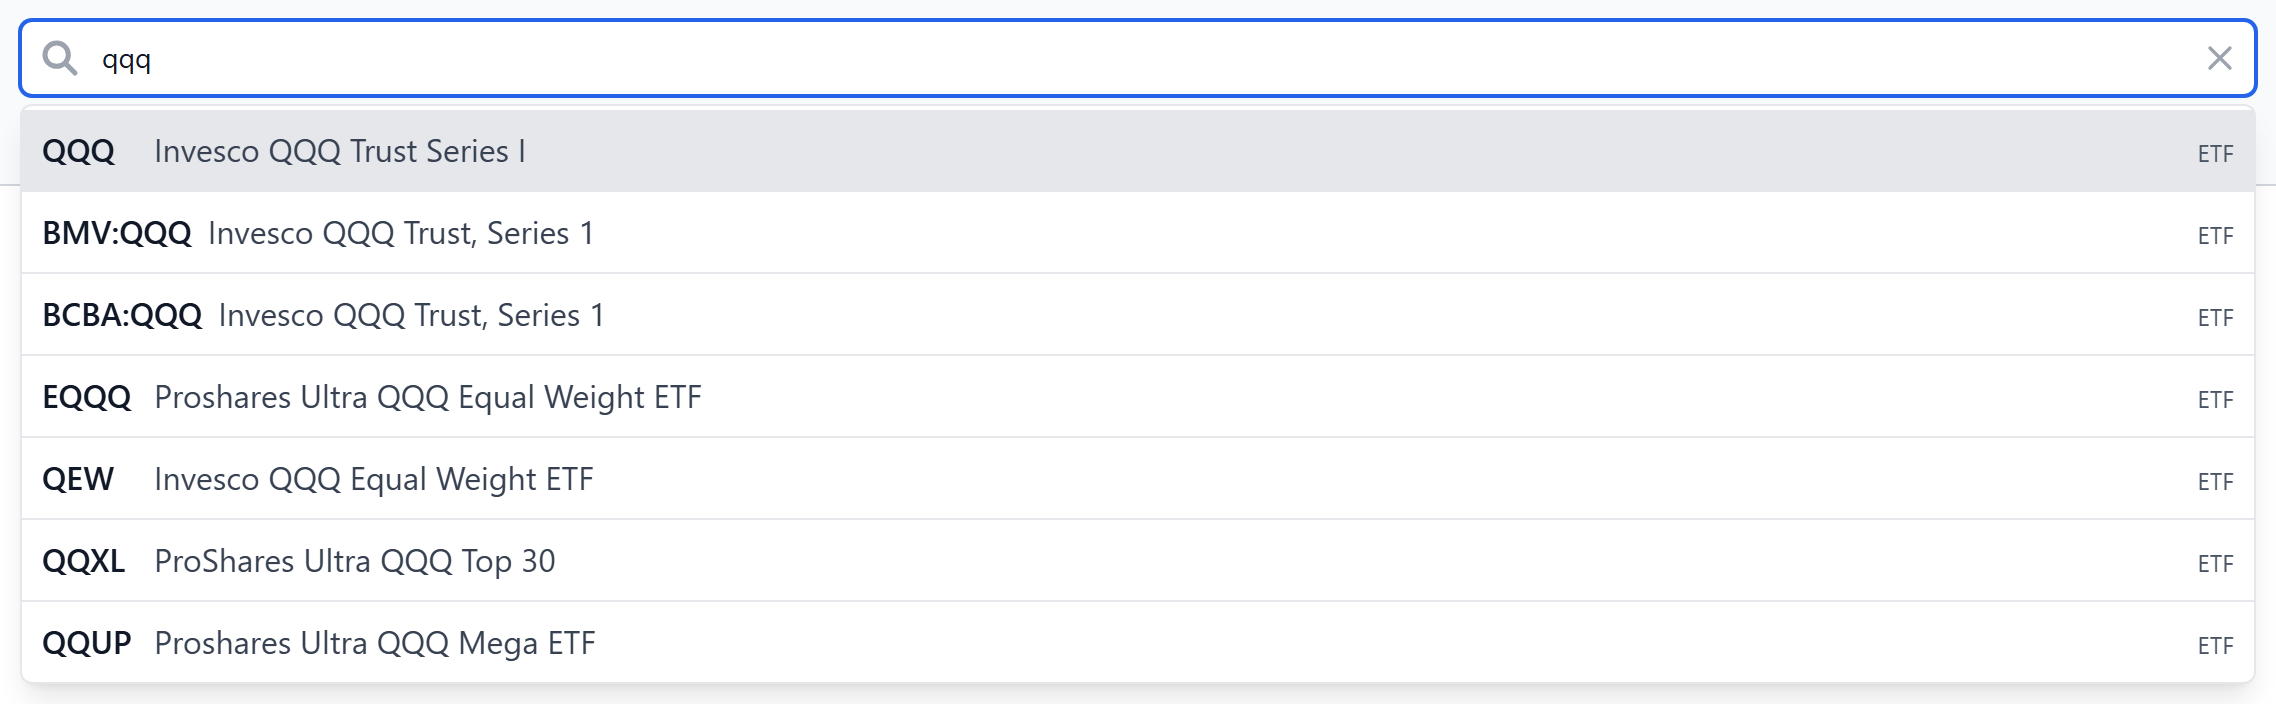
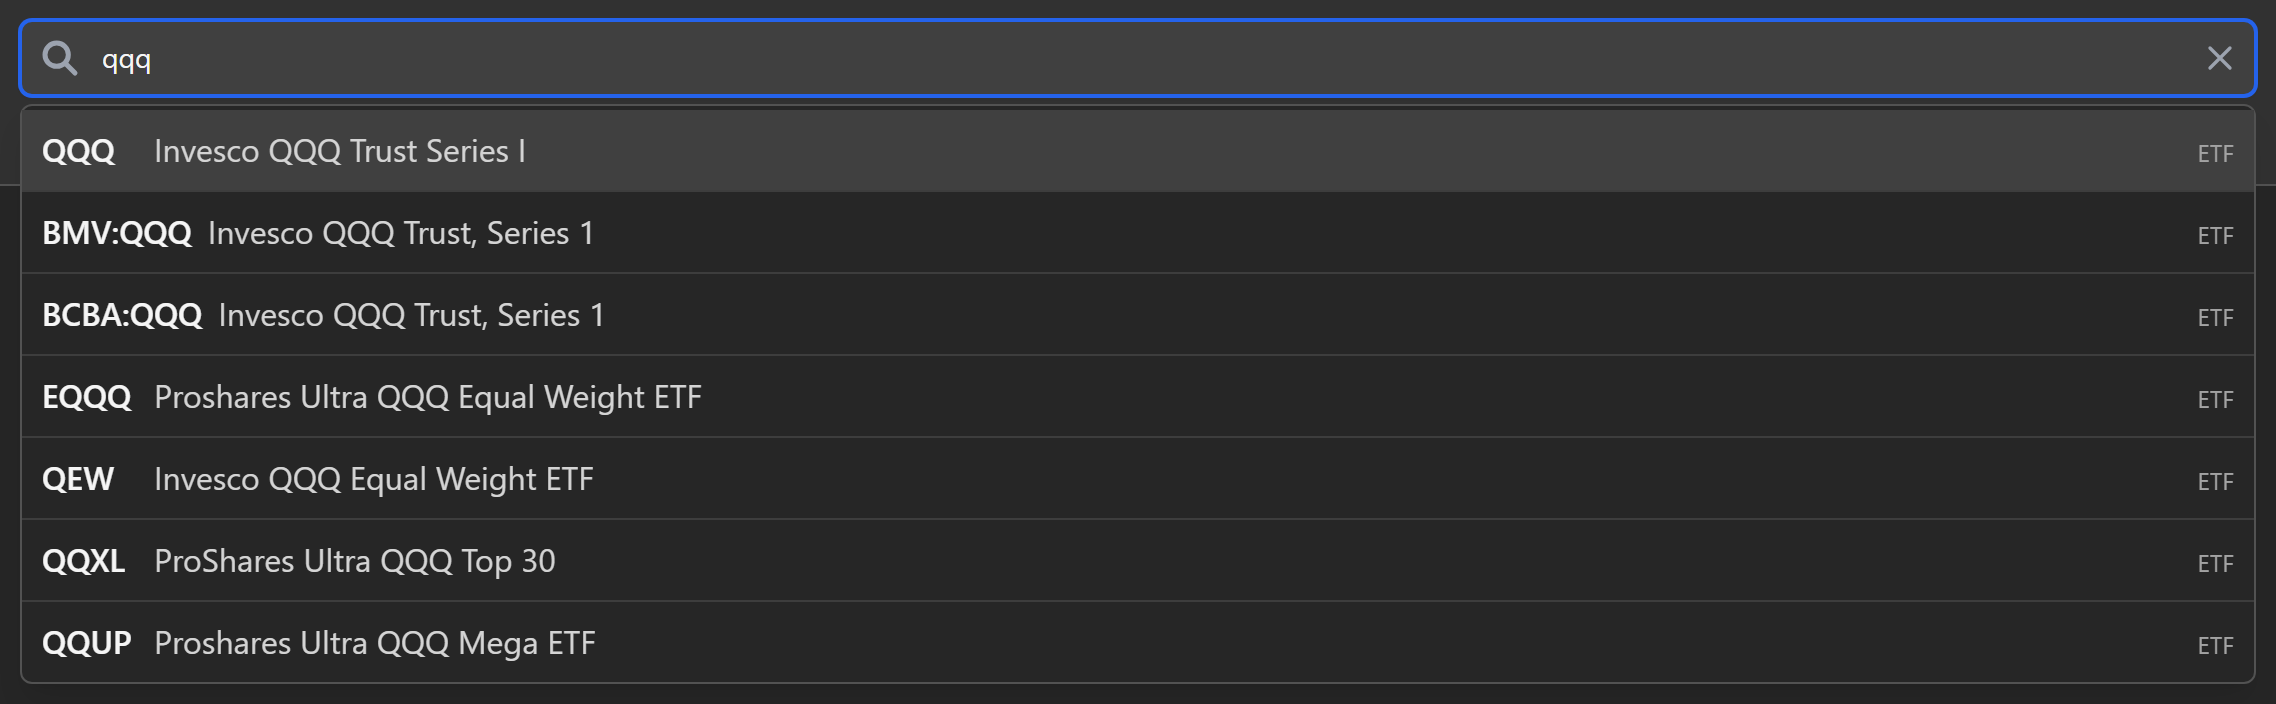
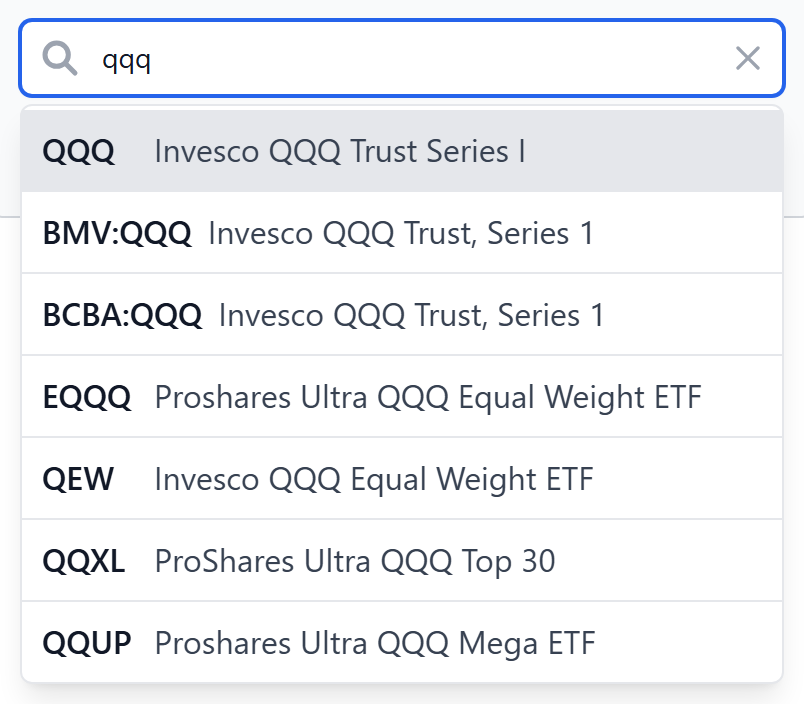
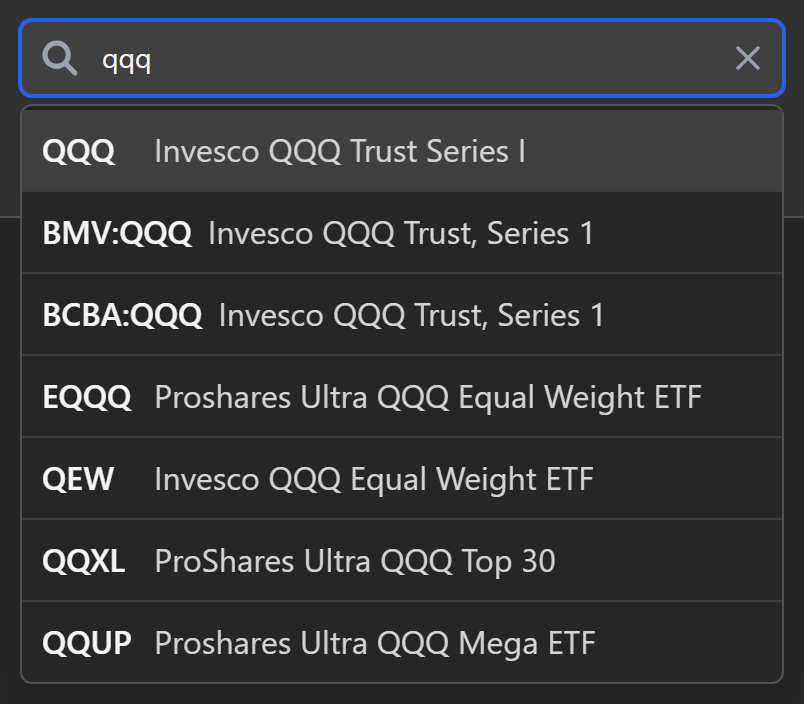
Pick a fund and it becomes a chip above the search box. Pick a second one and the comparison loads. If you just want to poke around first, the empty page offers a few common pairs to start from.
To swap a fund, clicktap the × on its chip and search for another. The order of the chips is the order of the columns in every table below.
Read the summary
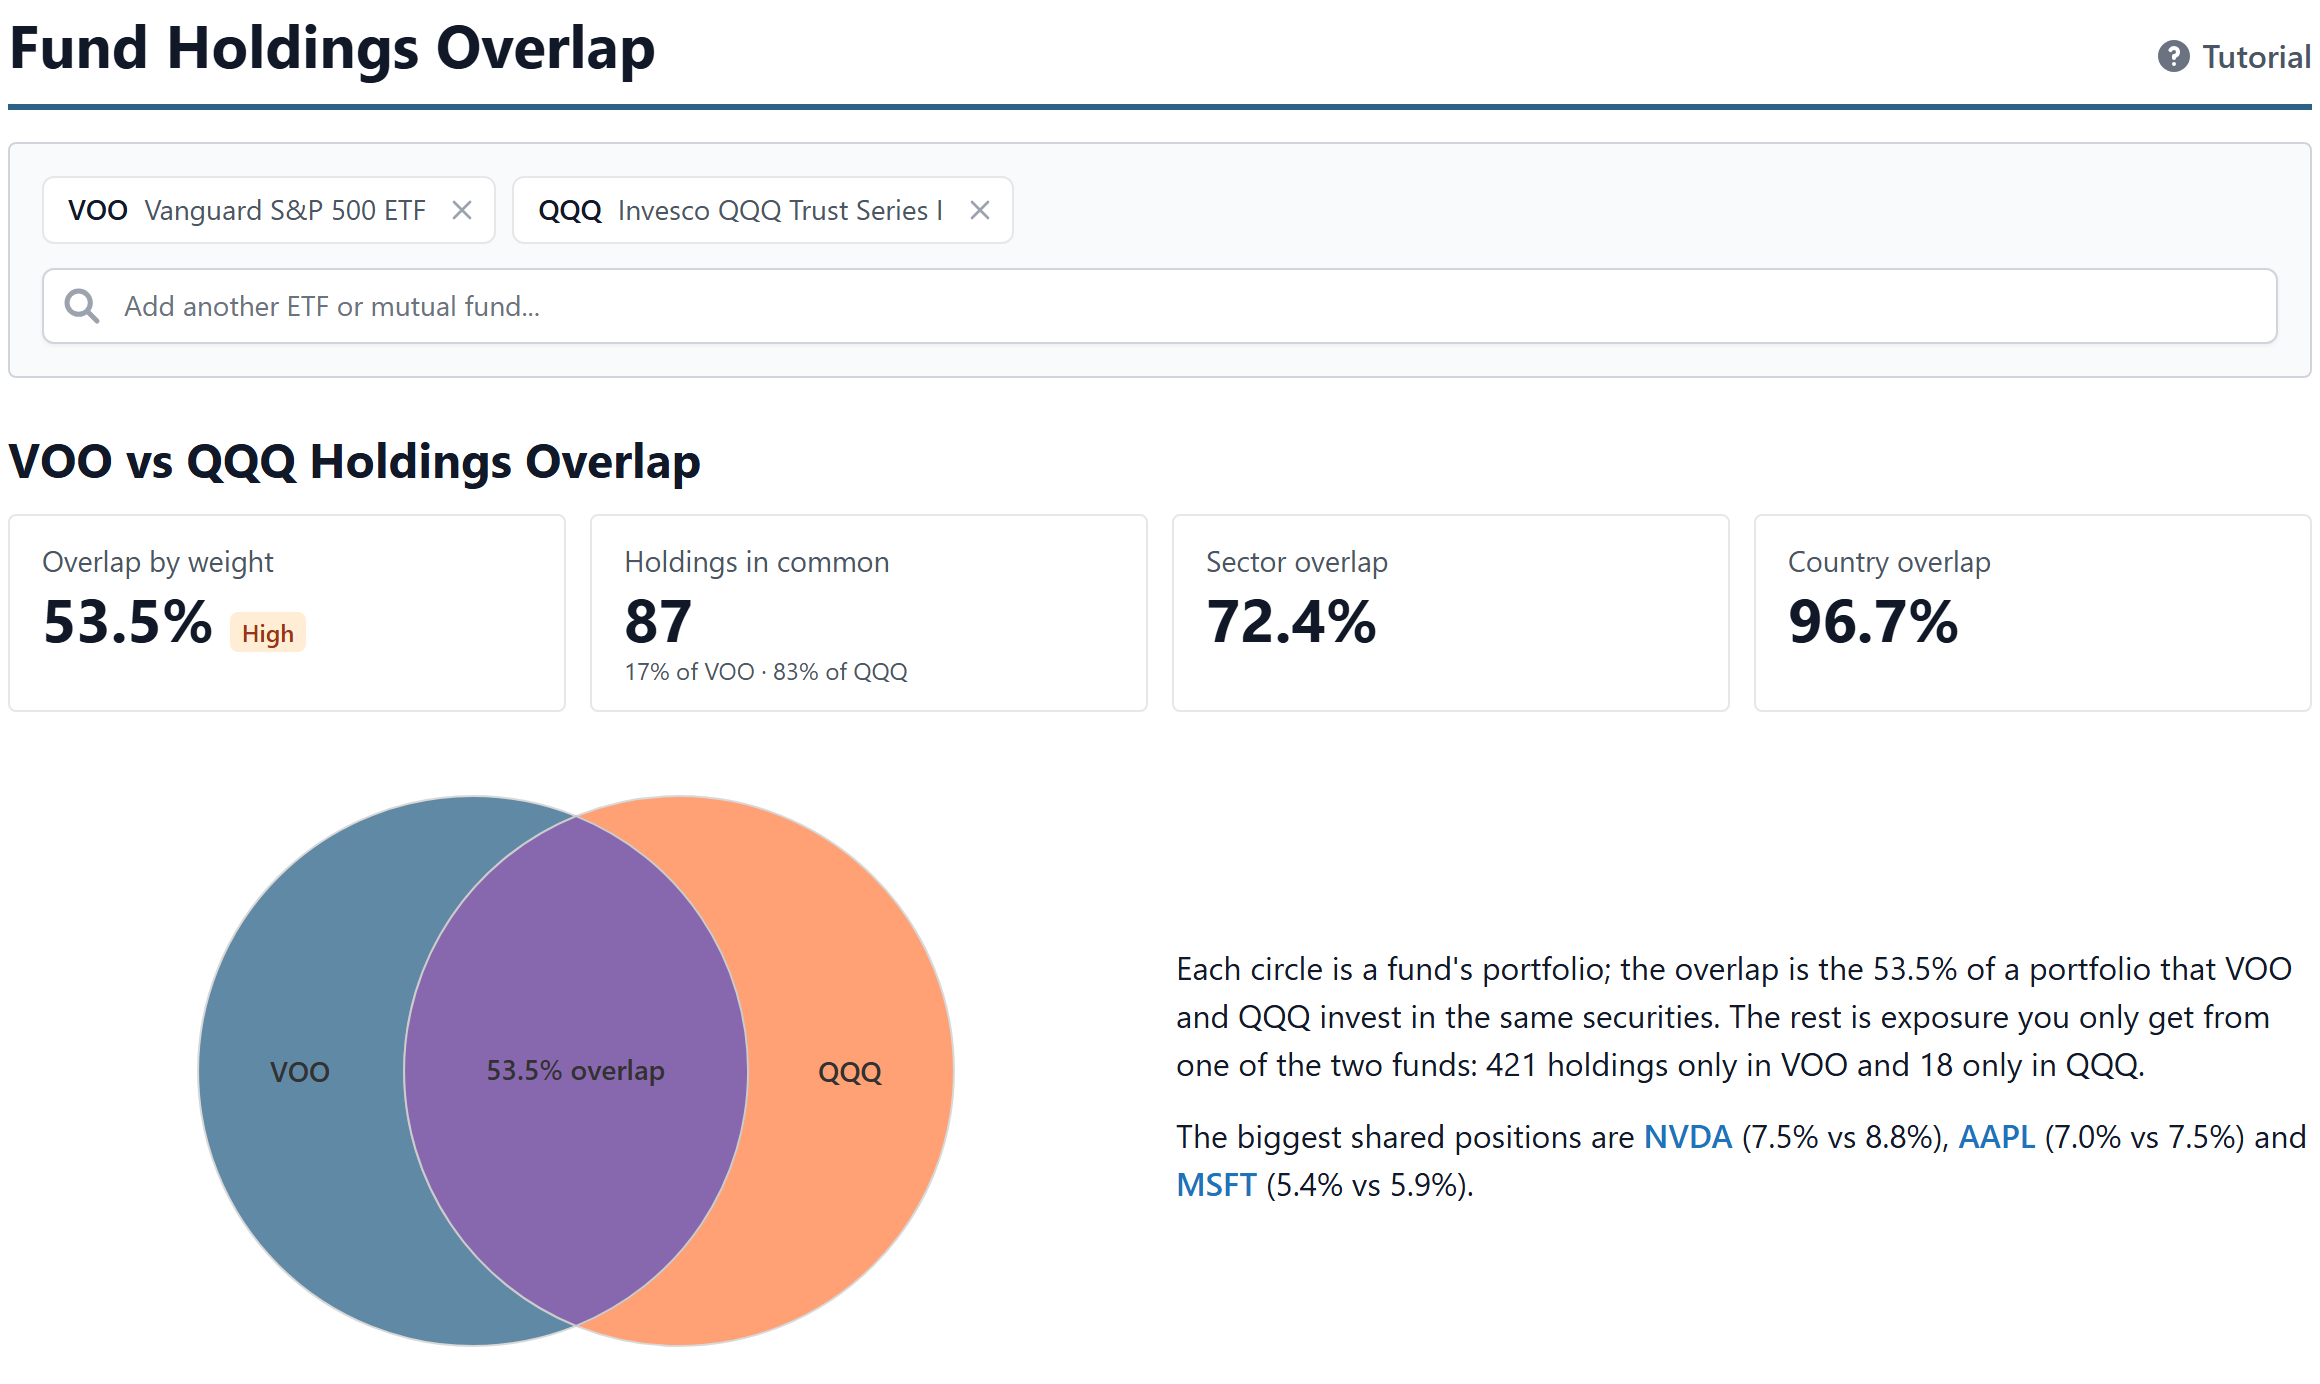
Four cards sum up the overlap:
- Overlap by weight is the headline number: the share of a portfolio that is invested in the same securities in both funds. The badge next to it rates it Low, Moderate, High or Very high.
- Holdings in common counts the shared securities, and shows what share of each fund's holdings that is. QQQ's 100 or so stocks can be almost entirely inside VOO while being a small slice of VOO's 500.
- Sector overlap does the same math on the funds' sector weights, and Country overlap on their country weights.


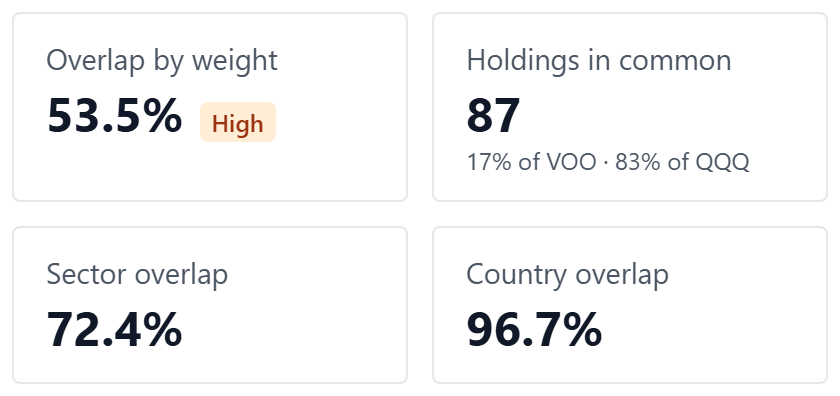
The badge follows a common rule of thumb. Under 20% is Low: the funds hold mostly different things and diversify each other. 20% to 50% is Moderate, meaningful duplication. Above 50% is High, where they're largely doing the same job, and above 80% is Very high, which means near-clones.
The overlap chart
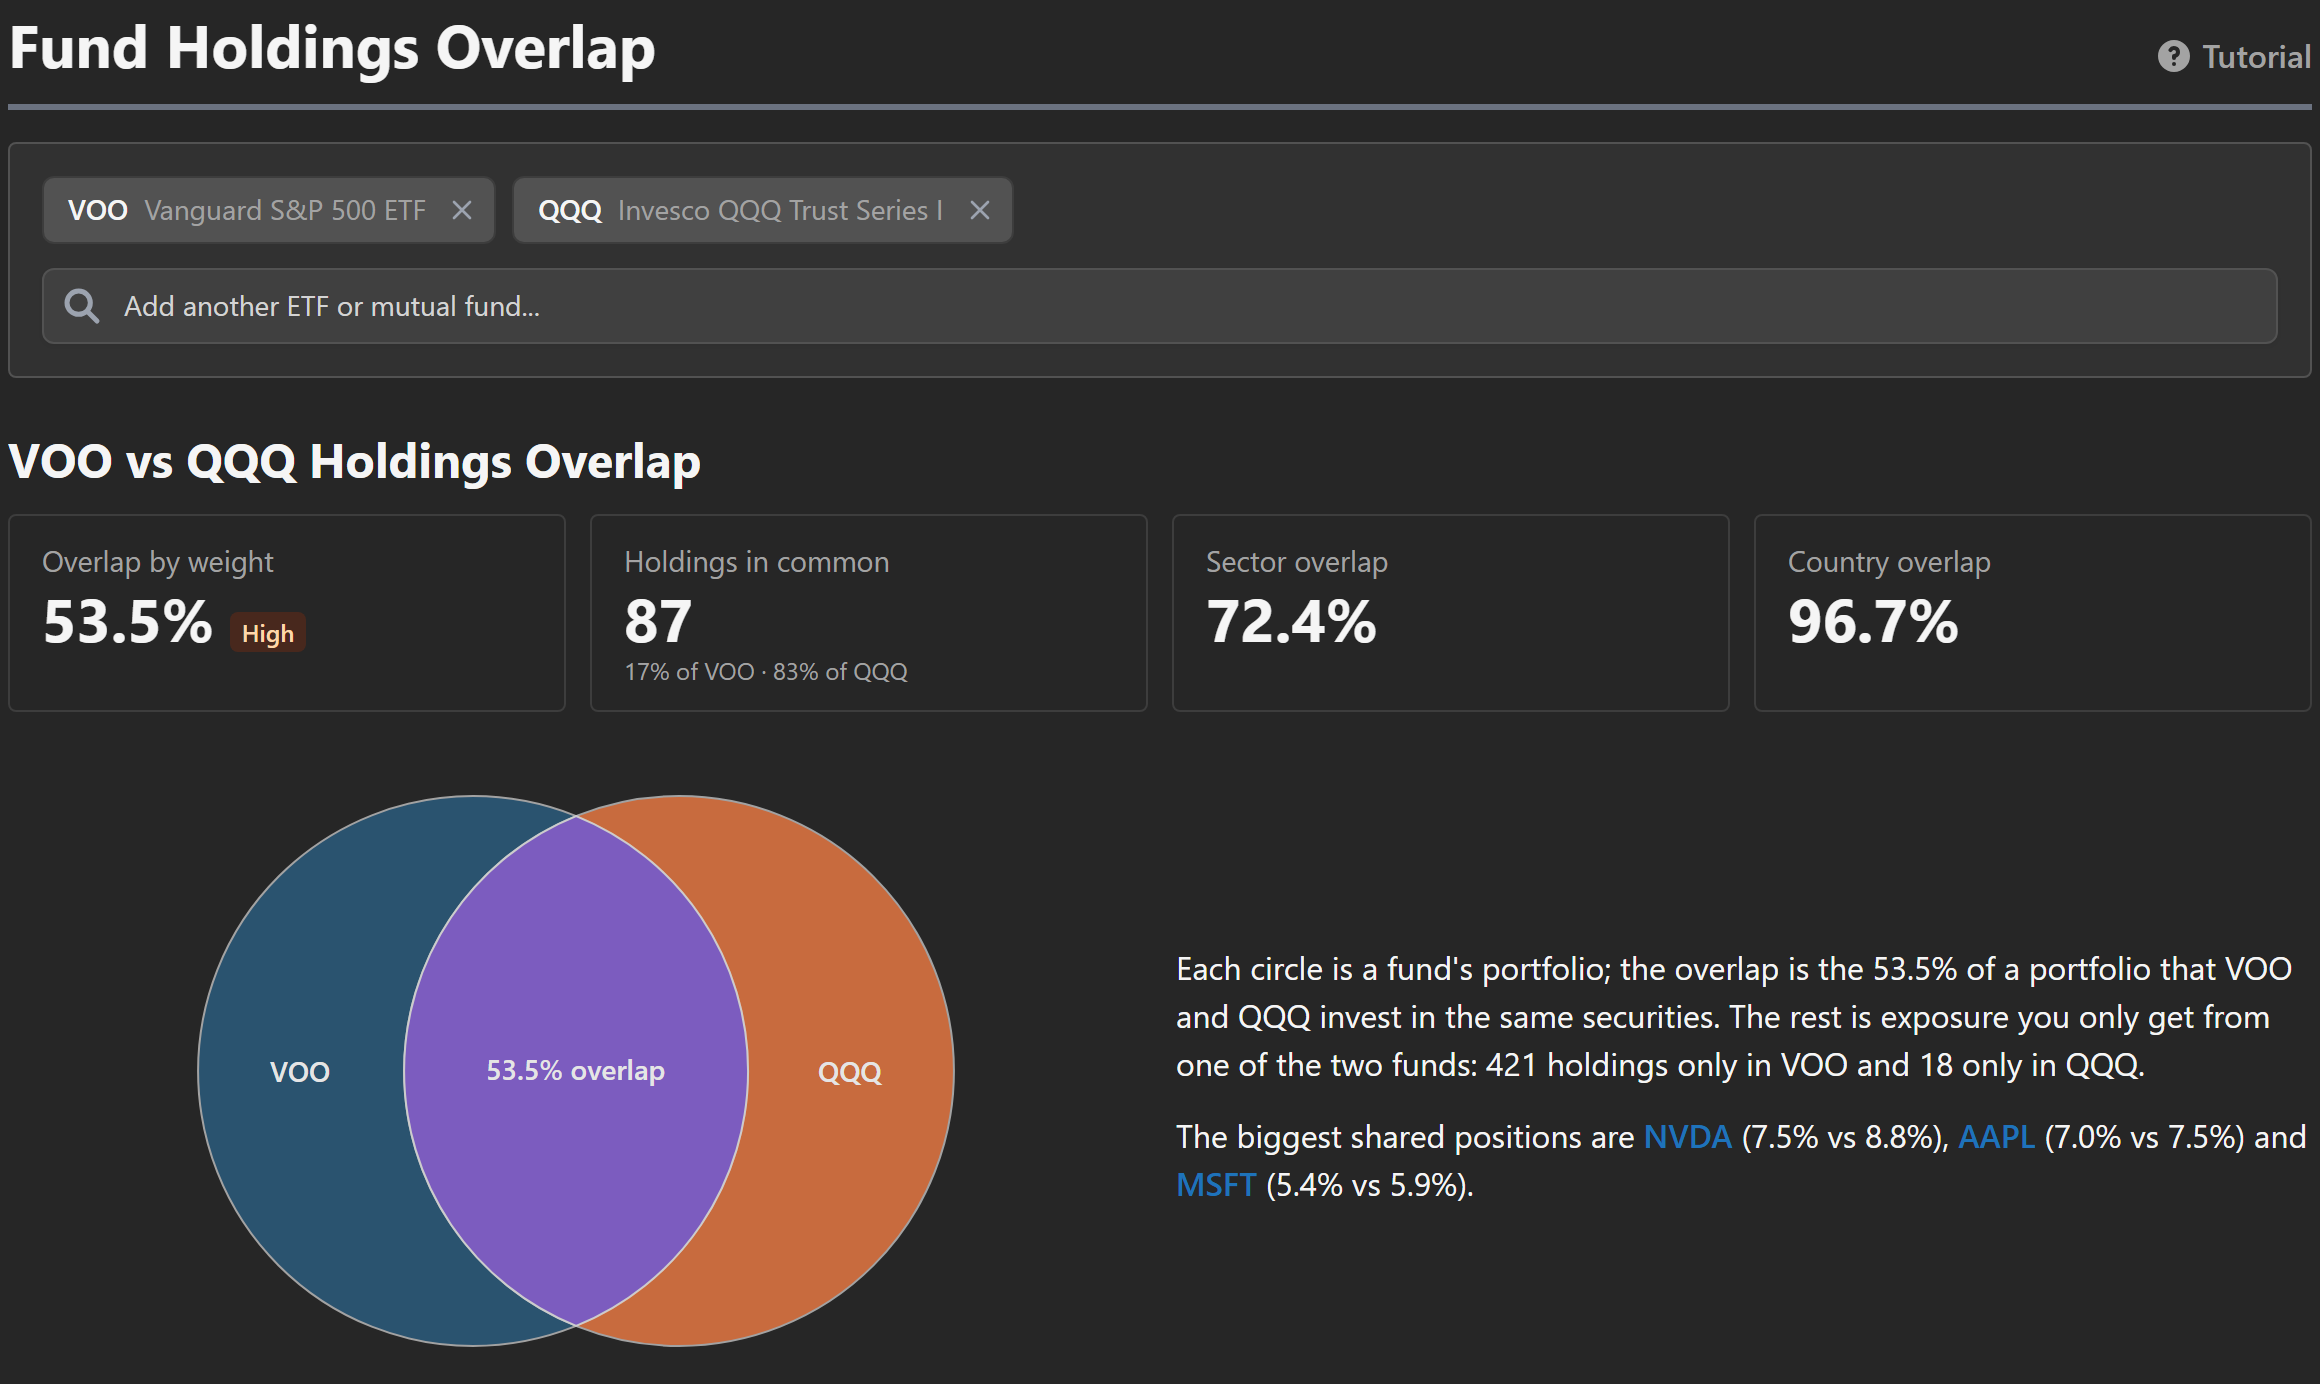
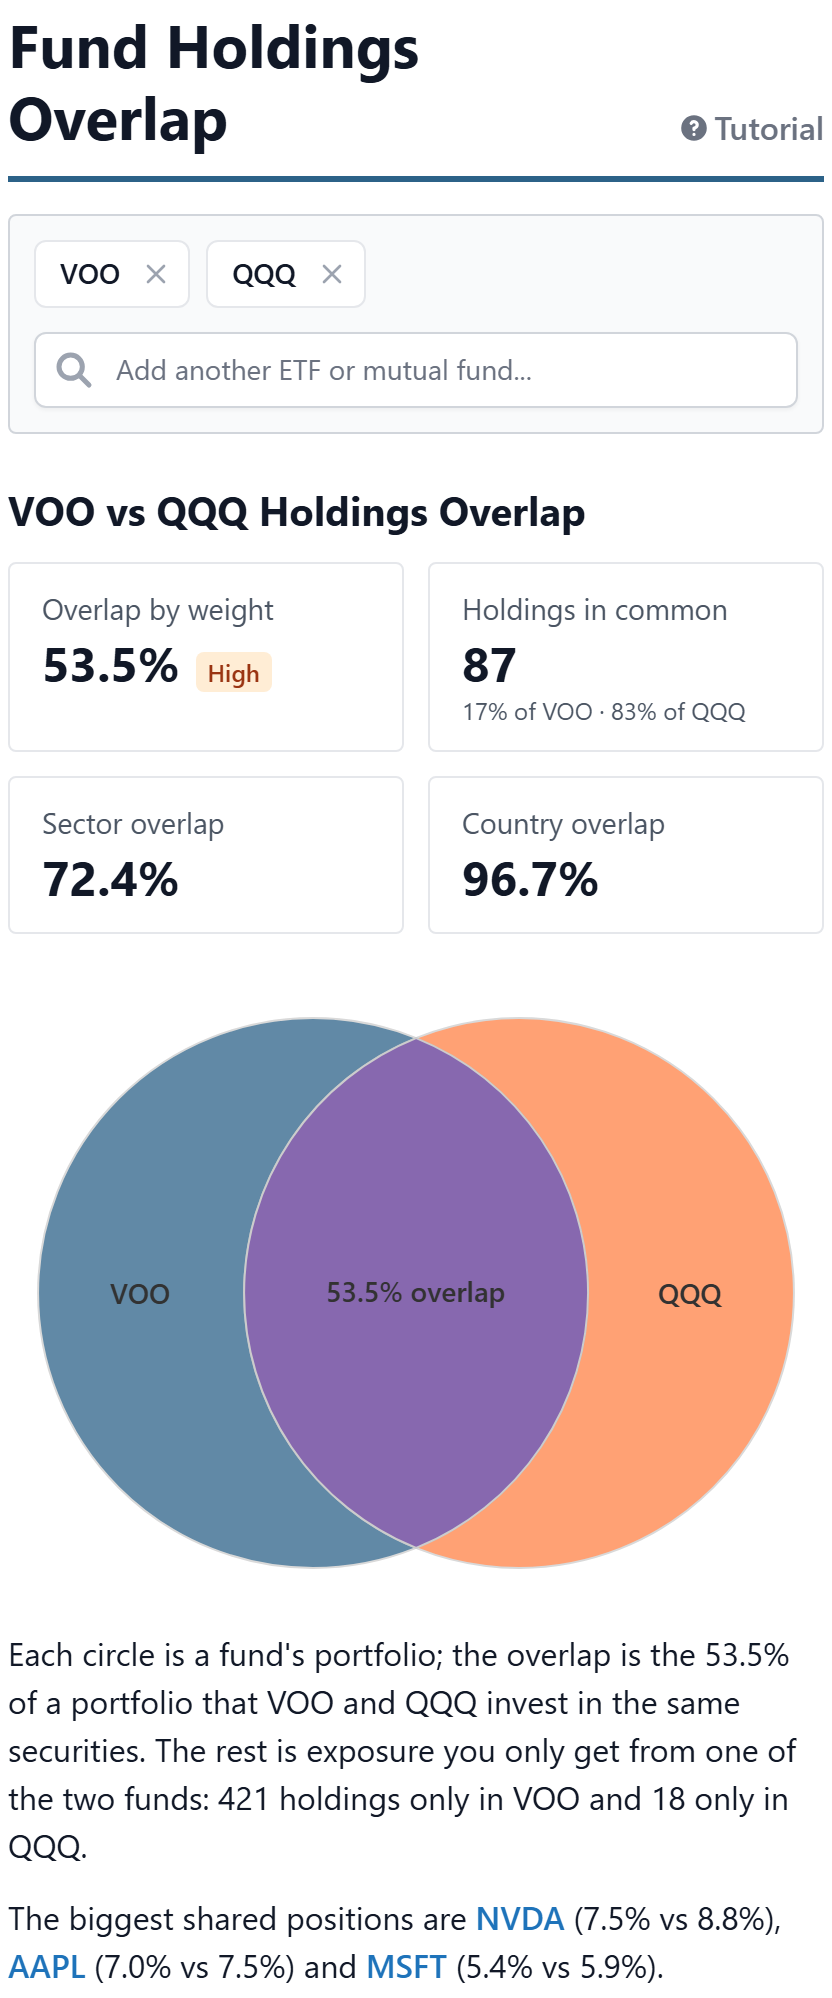
With two funds you get a Venn diagram. Each circle is one fund's portfolio and the purple lens is the overlap by weight, so the size of the lens is the number from the first card. The text beside it names the biggest shared positions and counts the holdings only one fund owns.
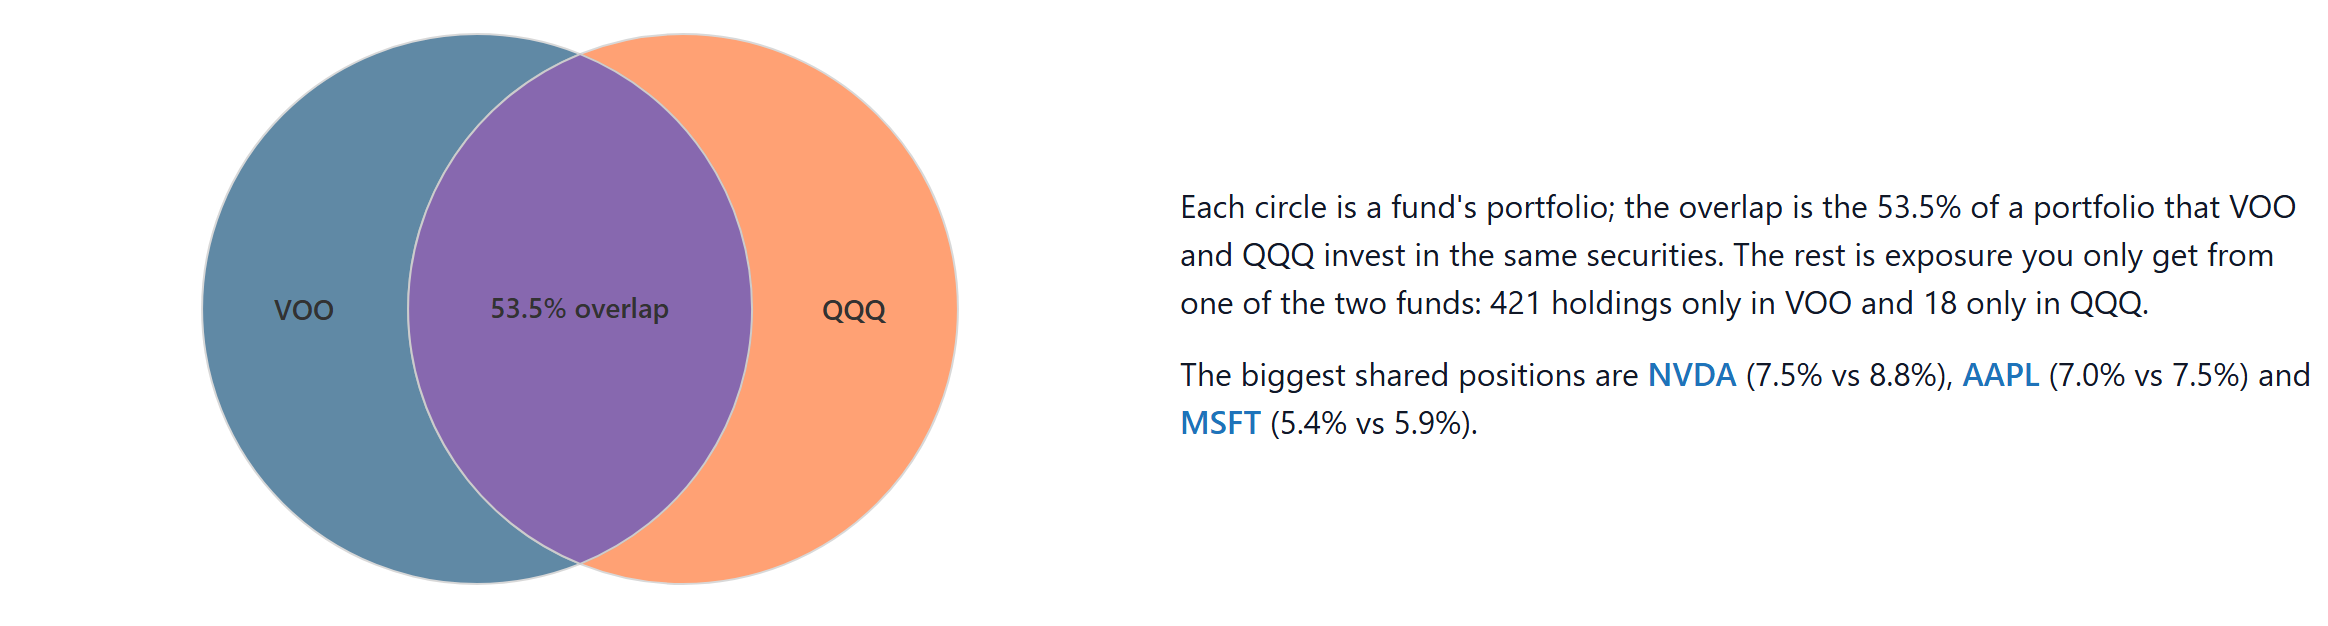
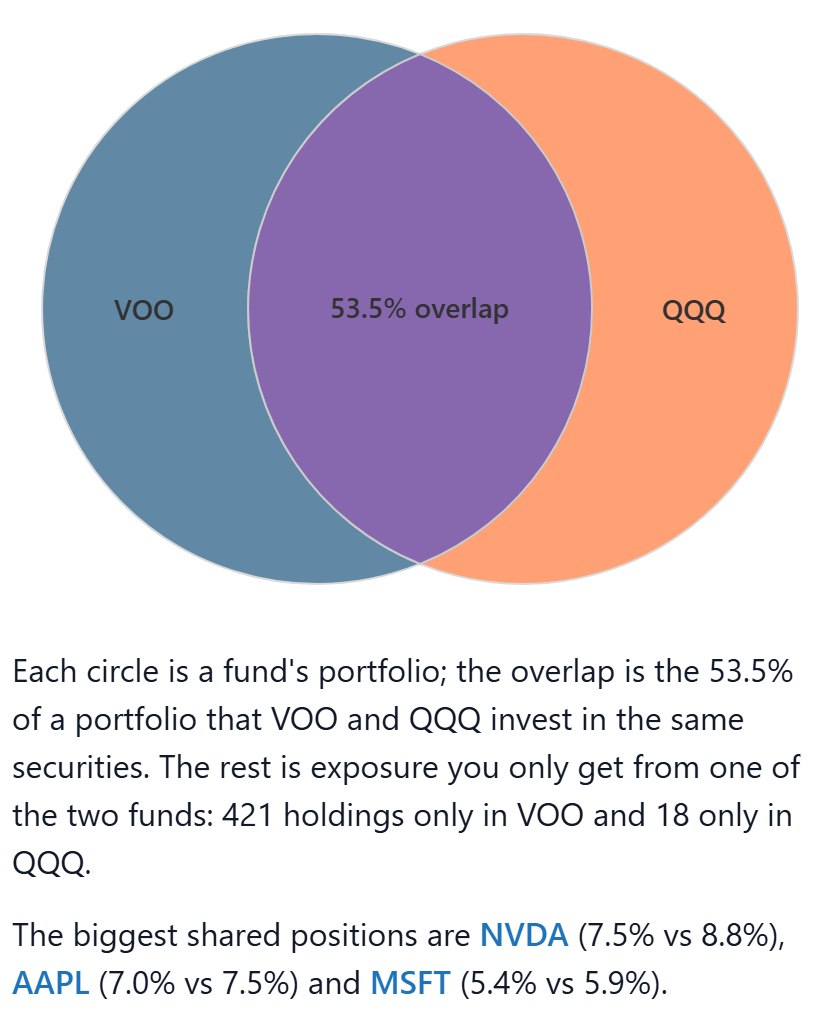
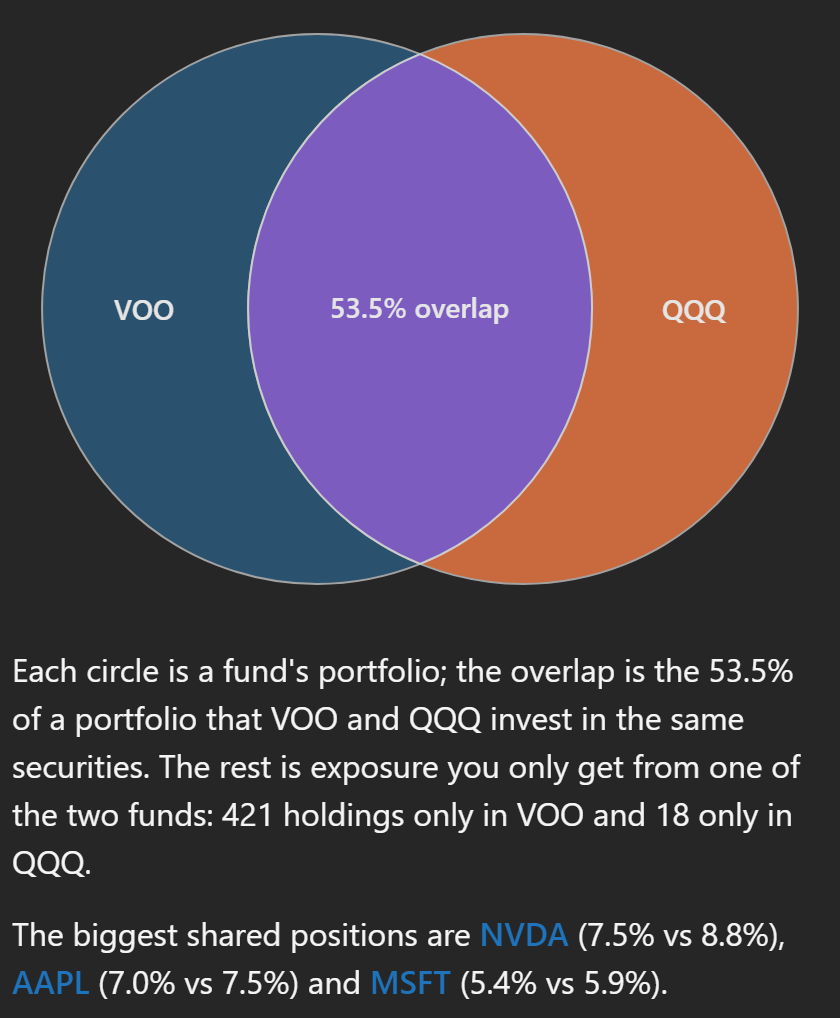
Hover overTap a circle to see how many holdings that fund has and how many of them are unique to it, or the lens for the exact overlap. With three or more funds the diagram gives way to a matrix; more on that in the section on comparing several funds.
Shared and unique holdings
The dropdown above the table, next to the Find box, switches between lists. It opens on Shared holdings, every security both funds own. Only in VOO and Only in QQQ are the holdings the other fund doesn't have. Each list shows how many holdings it has.
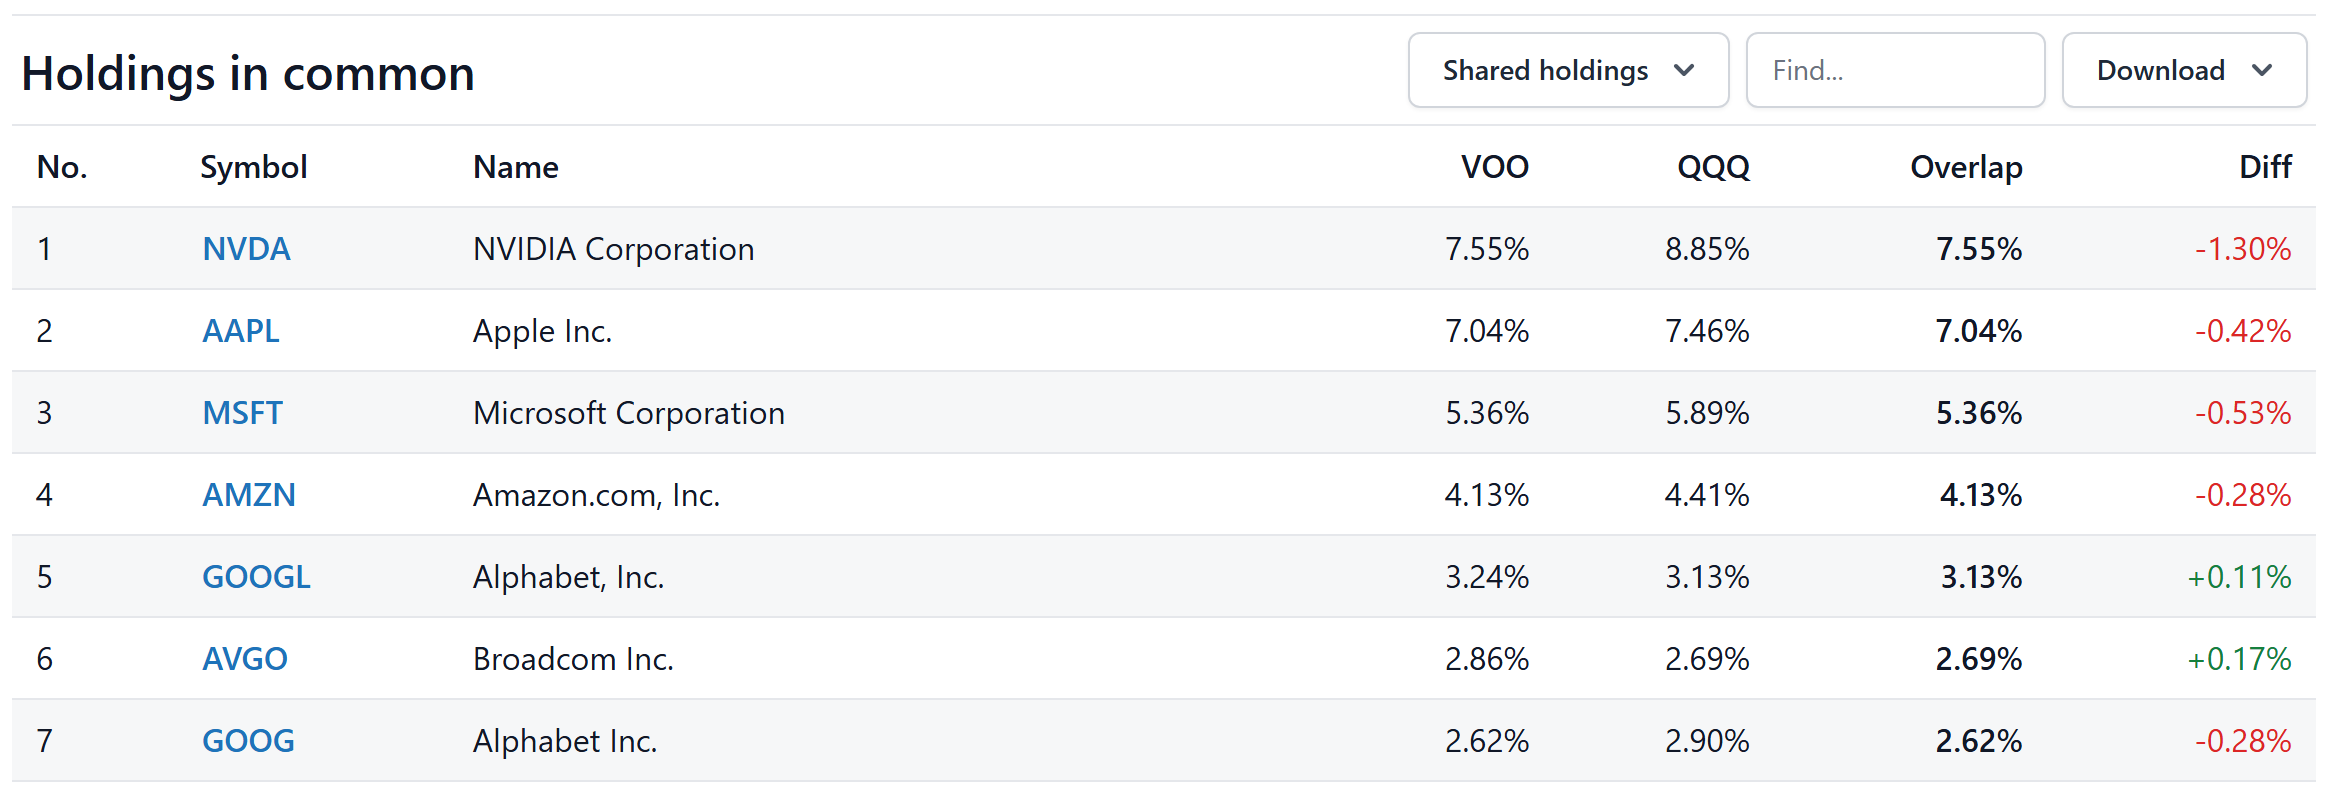
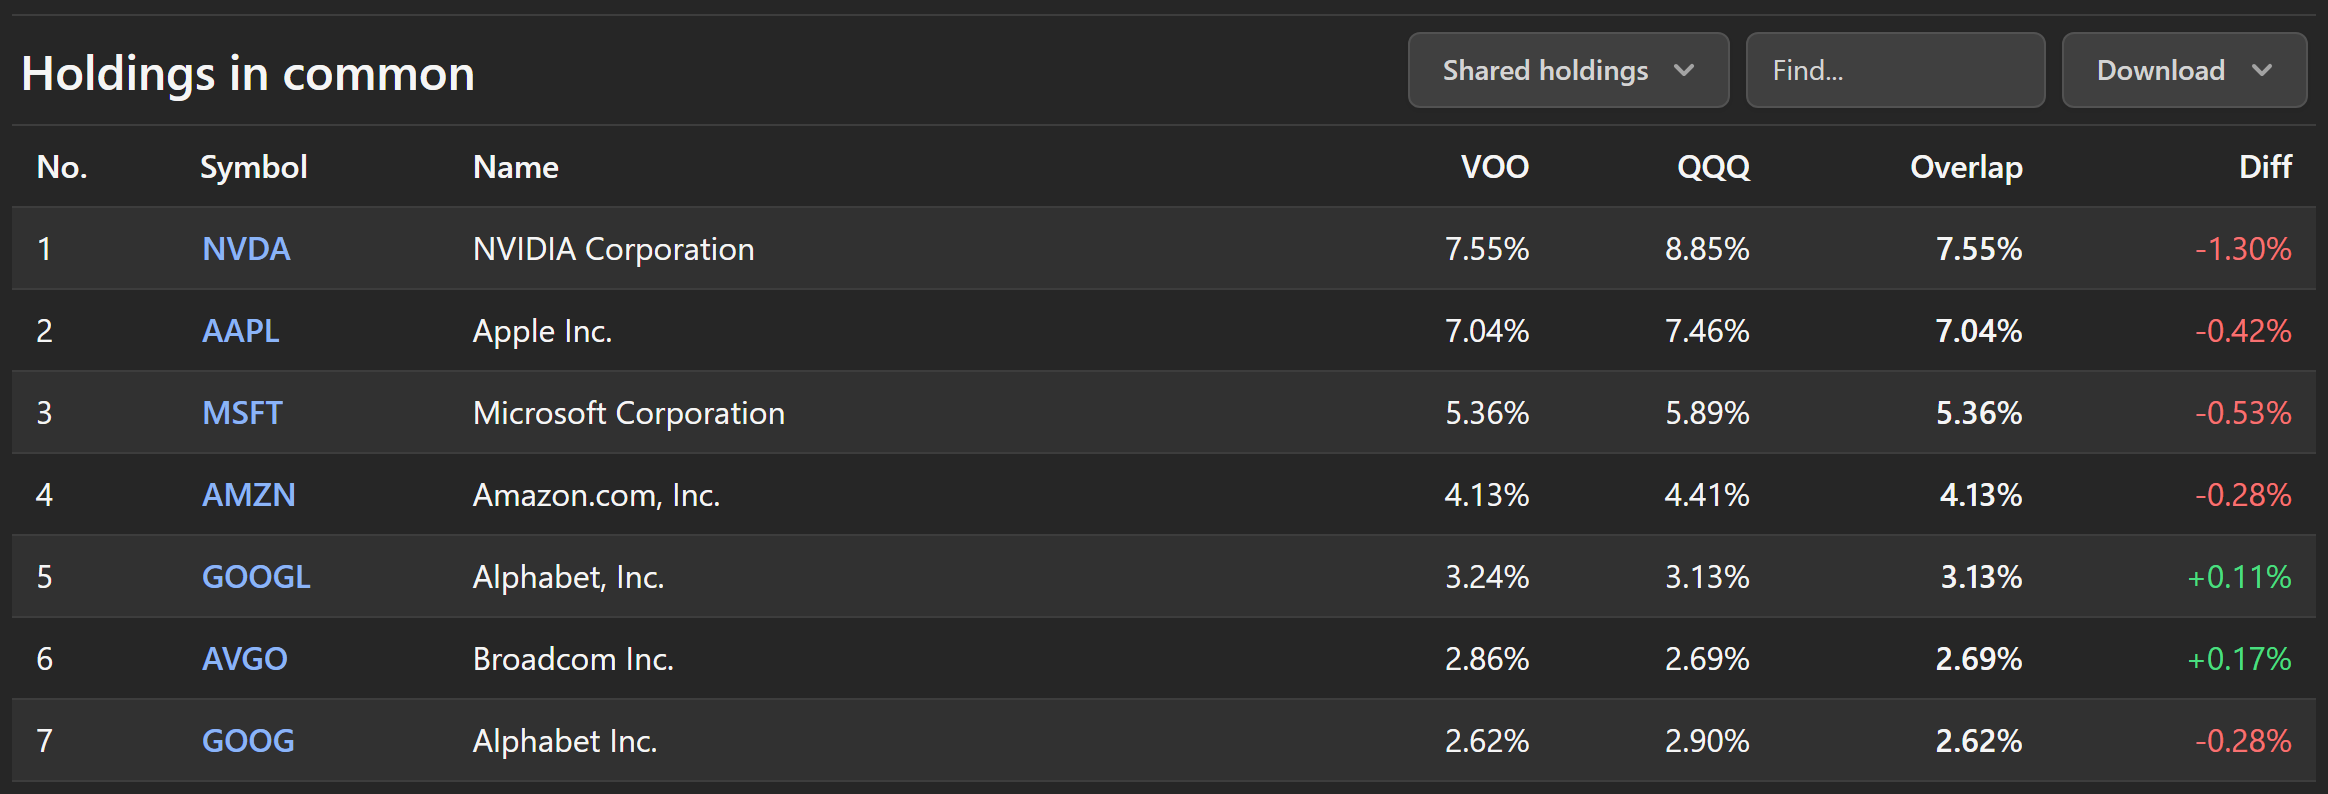
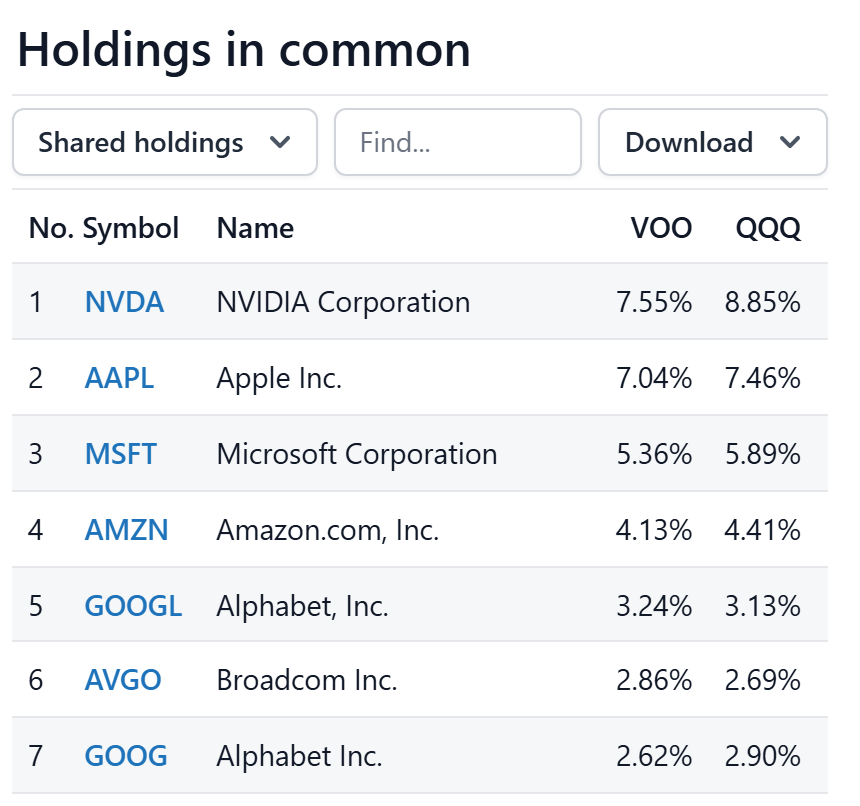
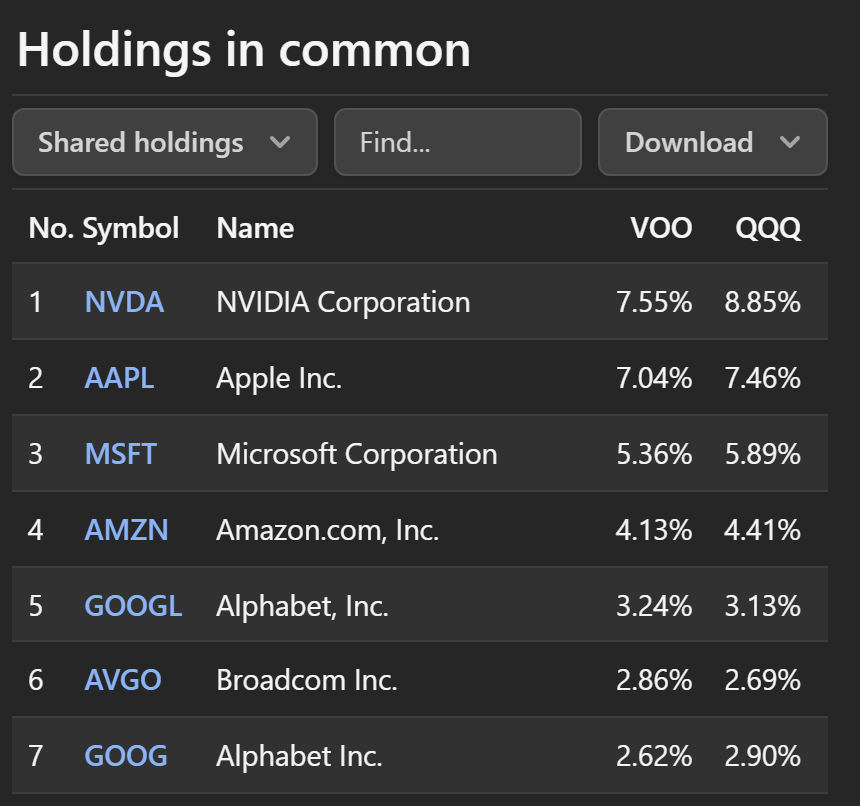
In the Shared holdings list each row shows the security's weight in each fund, then Overlap, which is the smaller of the two weights. Add up the Overlap column and you get the overlap by weight. Diff is the first fund's weight minus the second's, green when the first fund holds more and red when it holds less.
ClickTap a column header to sort by it, and again to flip the direction. The No. column keeps the original rank so you can always find your way back. The Find box narrows the list as you type: "nvidia" and "NVDA" both work. Symbols link to each security's page.
On a free account each list shows its top 20 holdings, which covers the positions that matter for the overlap number. The complete lists, with paging in steps of 20, 50 or 100 rows, are part of Stock Analysis Pro.
On a phone the table scrolls sideways. Swipe across a row to reach the Overlap and Diff columns.
Sector and country overlap
Two funds can share few stocks and still carry the same risk. A US technology ETF and a European technology ETF may have no holdings in common while both being 100% technology. The Sector overlap table puts the funds' sector weights side by side; the Shared column is the smaller of the two, and those add up to the sector overlap on the summary card.
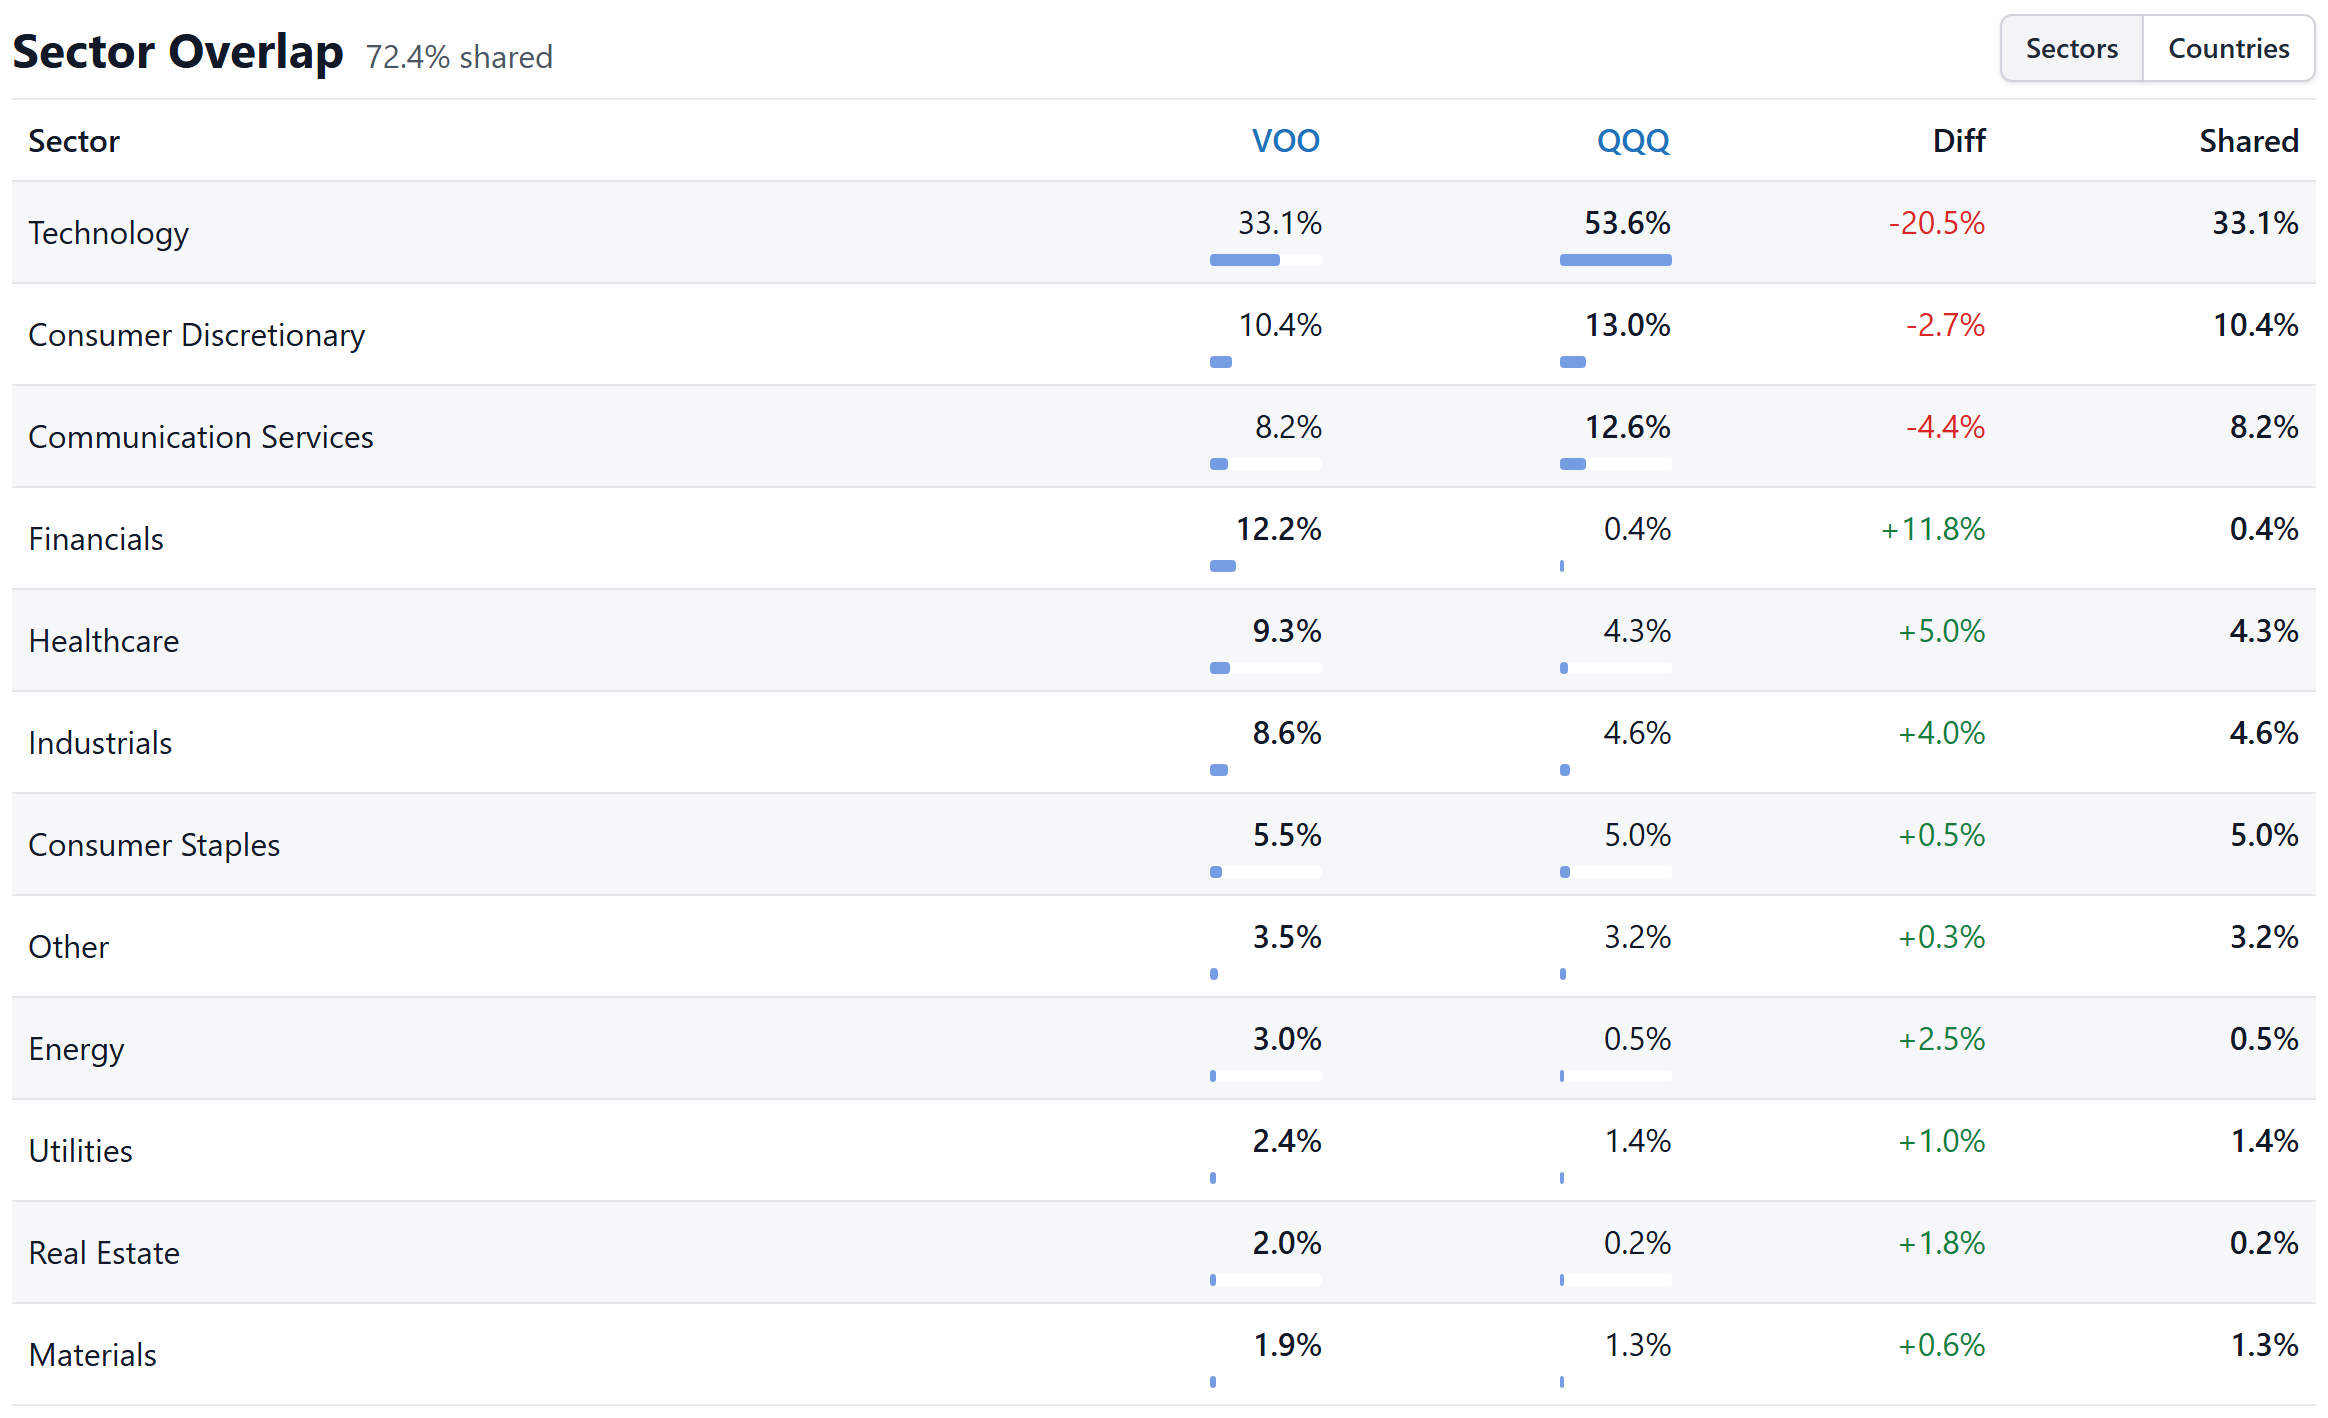
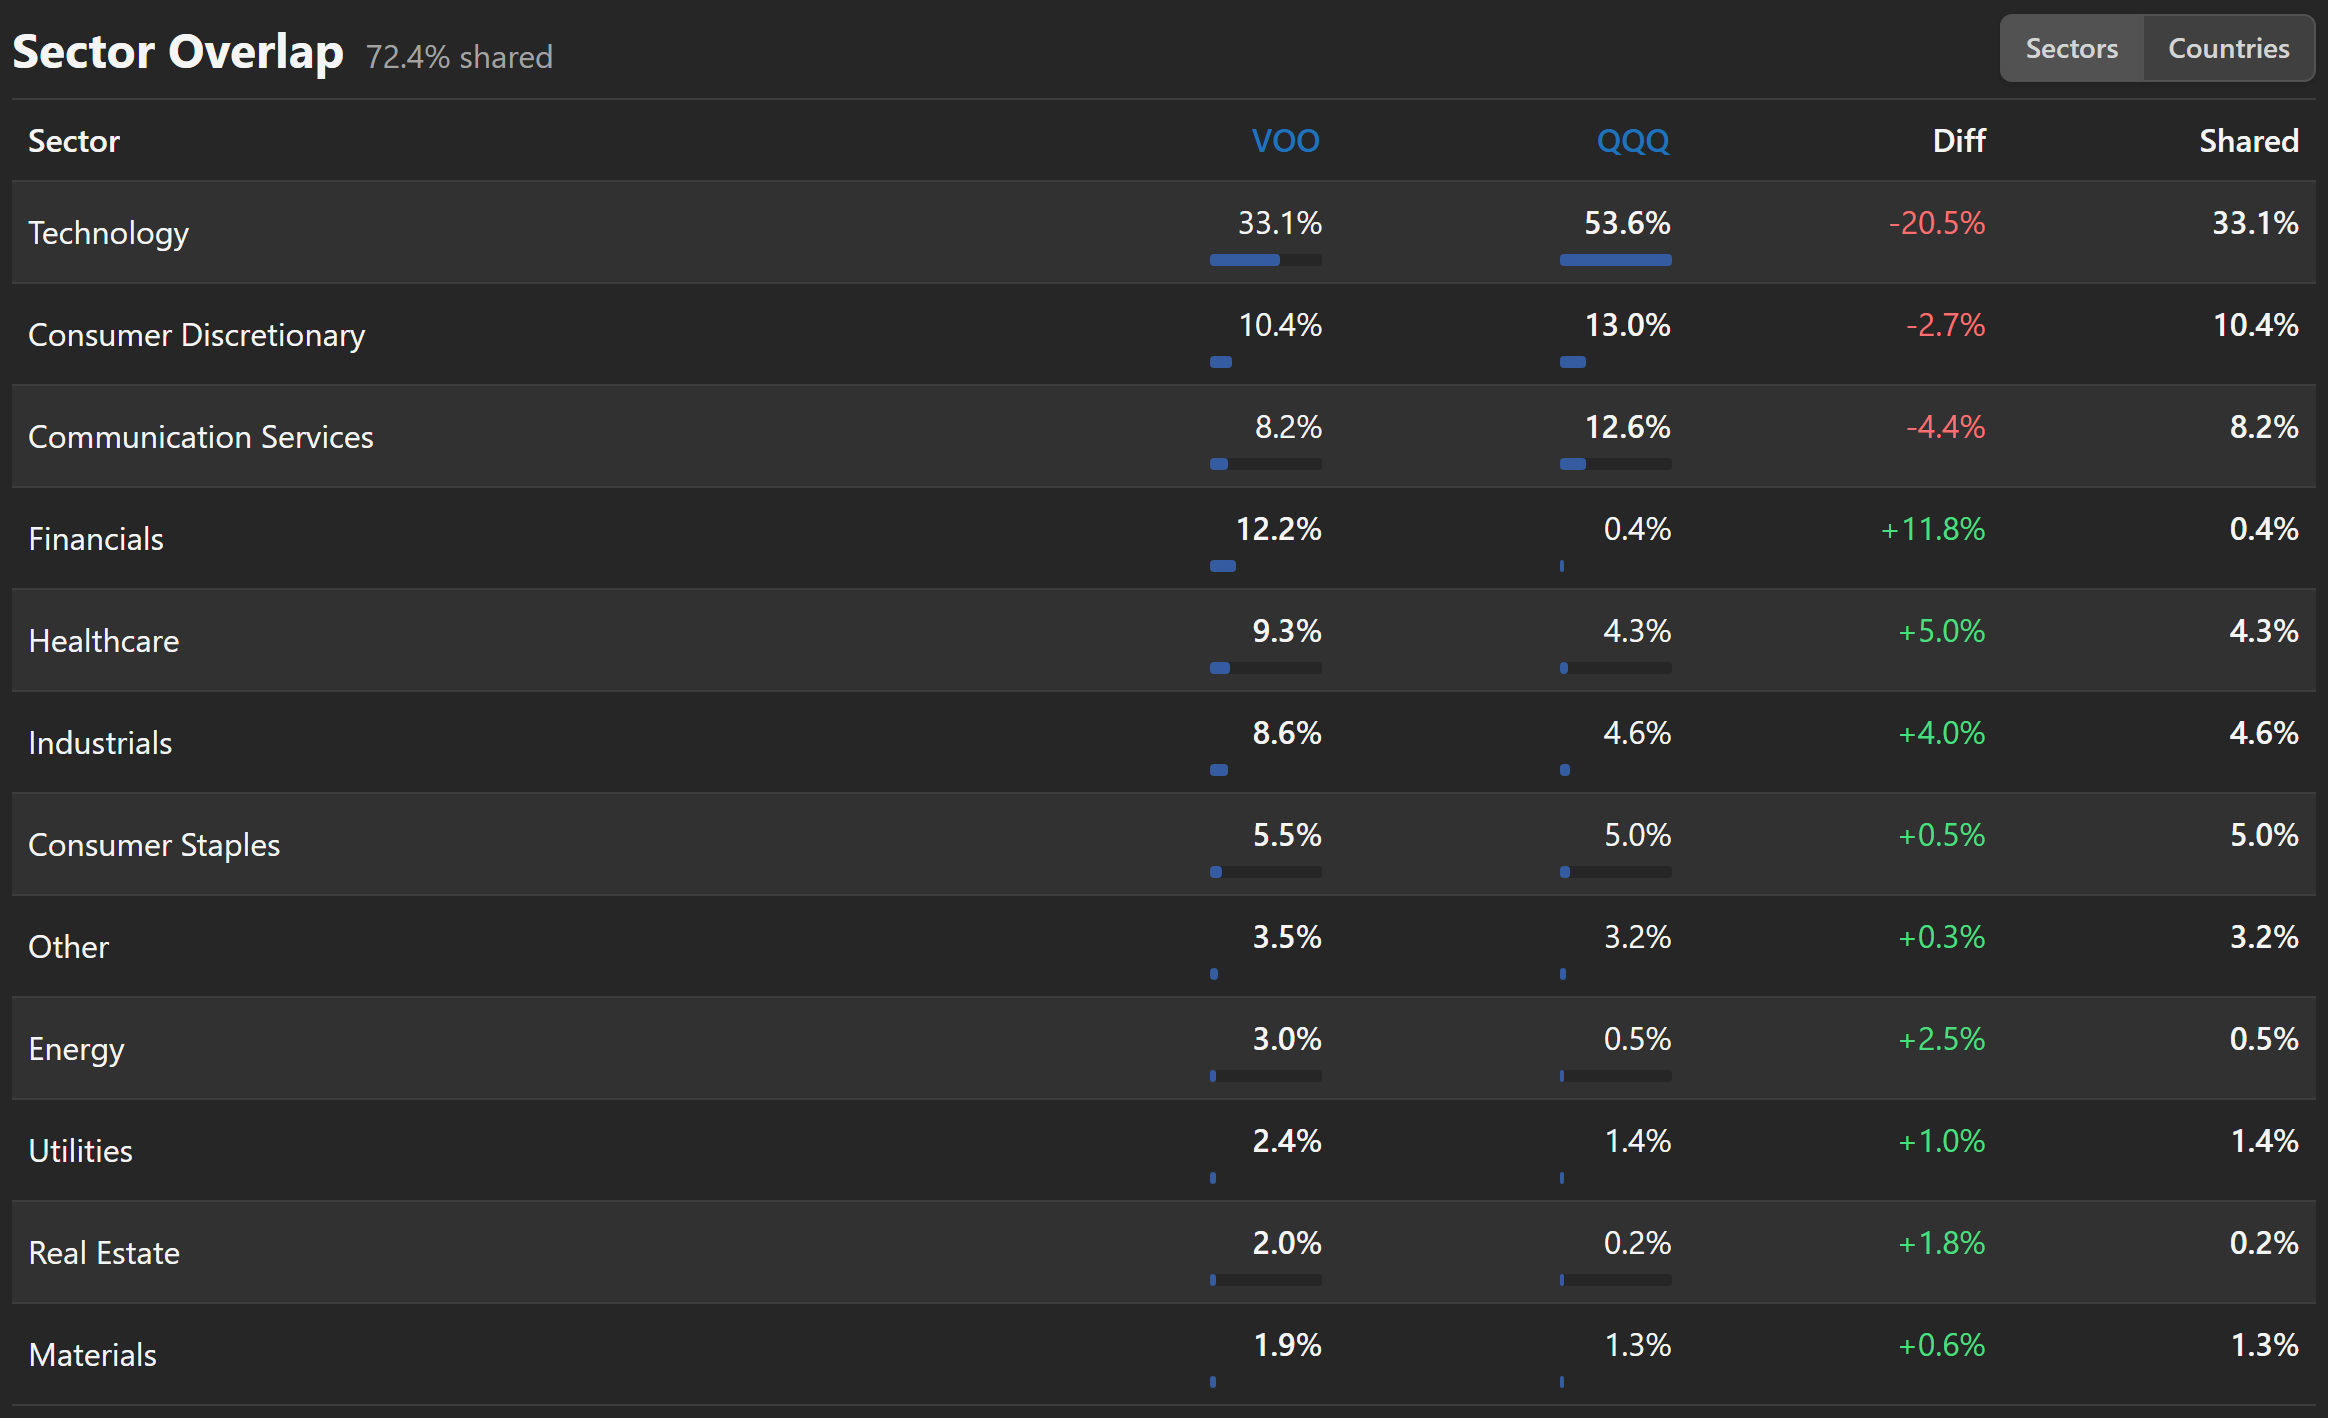
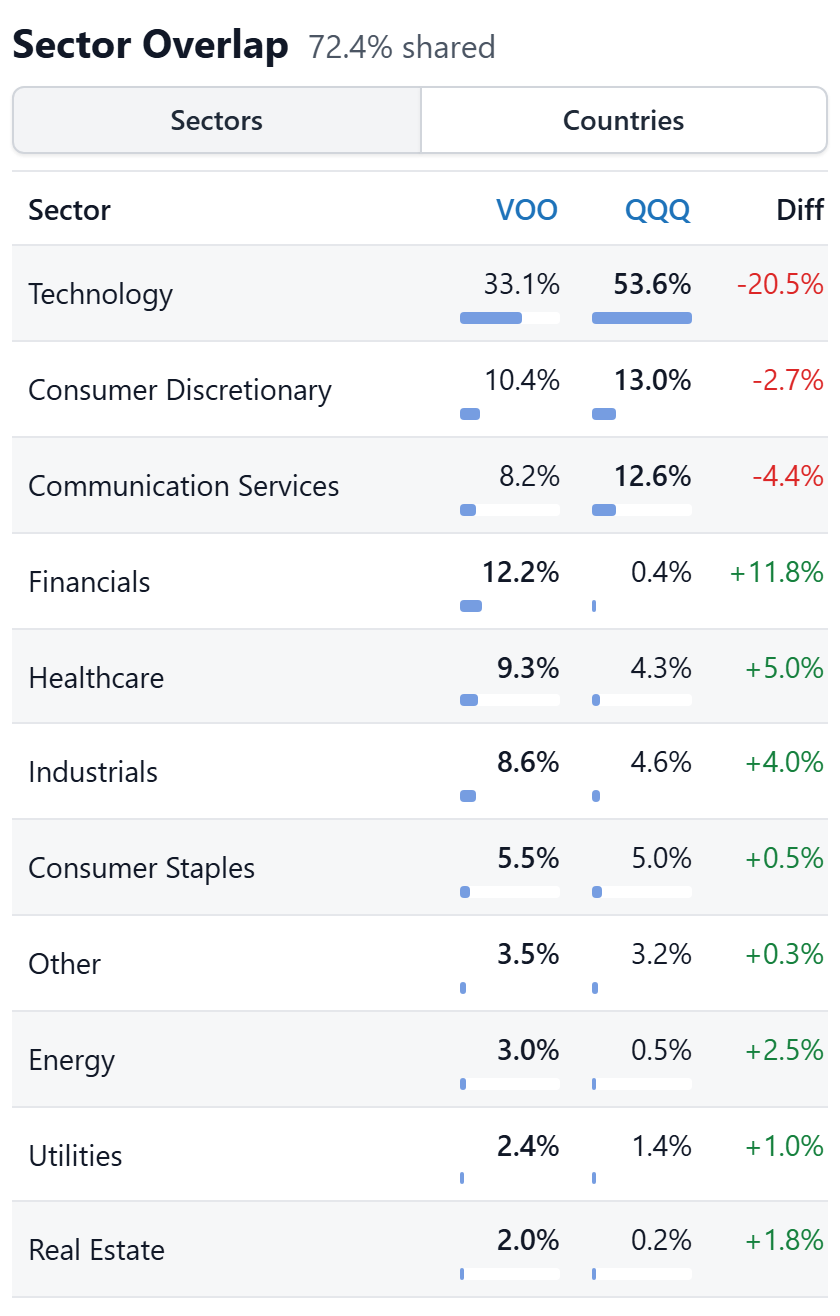
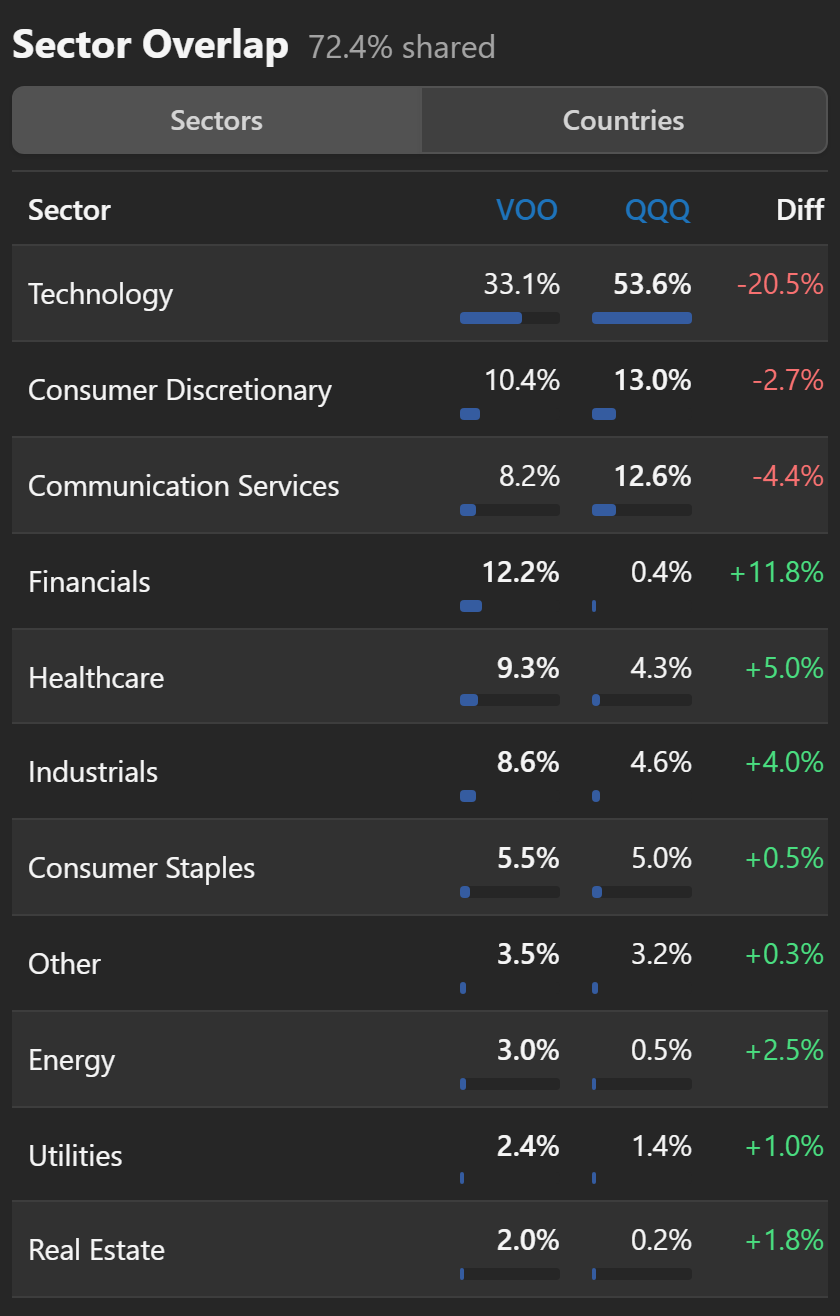
The Countries button swaps the table to the funds' country weights. Both views use the same rule, so the numbers read the same way.
Blend them into one portfolio
Owning both funds is really owning one blended portfolio. The Combined Portfolio section lists the funds again, this time with each one's share of the blend. It starts as an equal split: each fund shows 50%. To use your real allocation, clicktap a percentage, type a number, say 70, and press Enter. The other fund adjusts to fill the rest, so the split always adds up to 100.
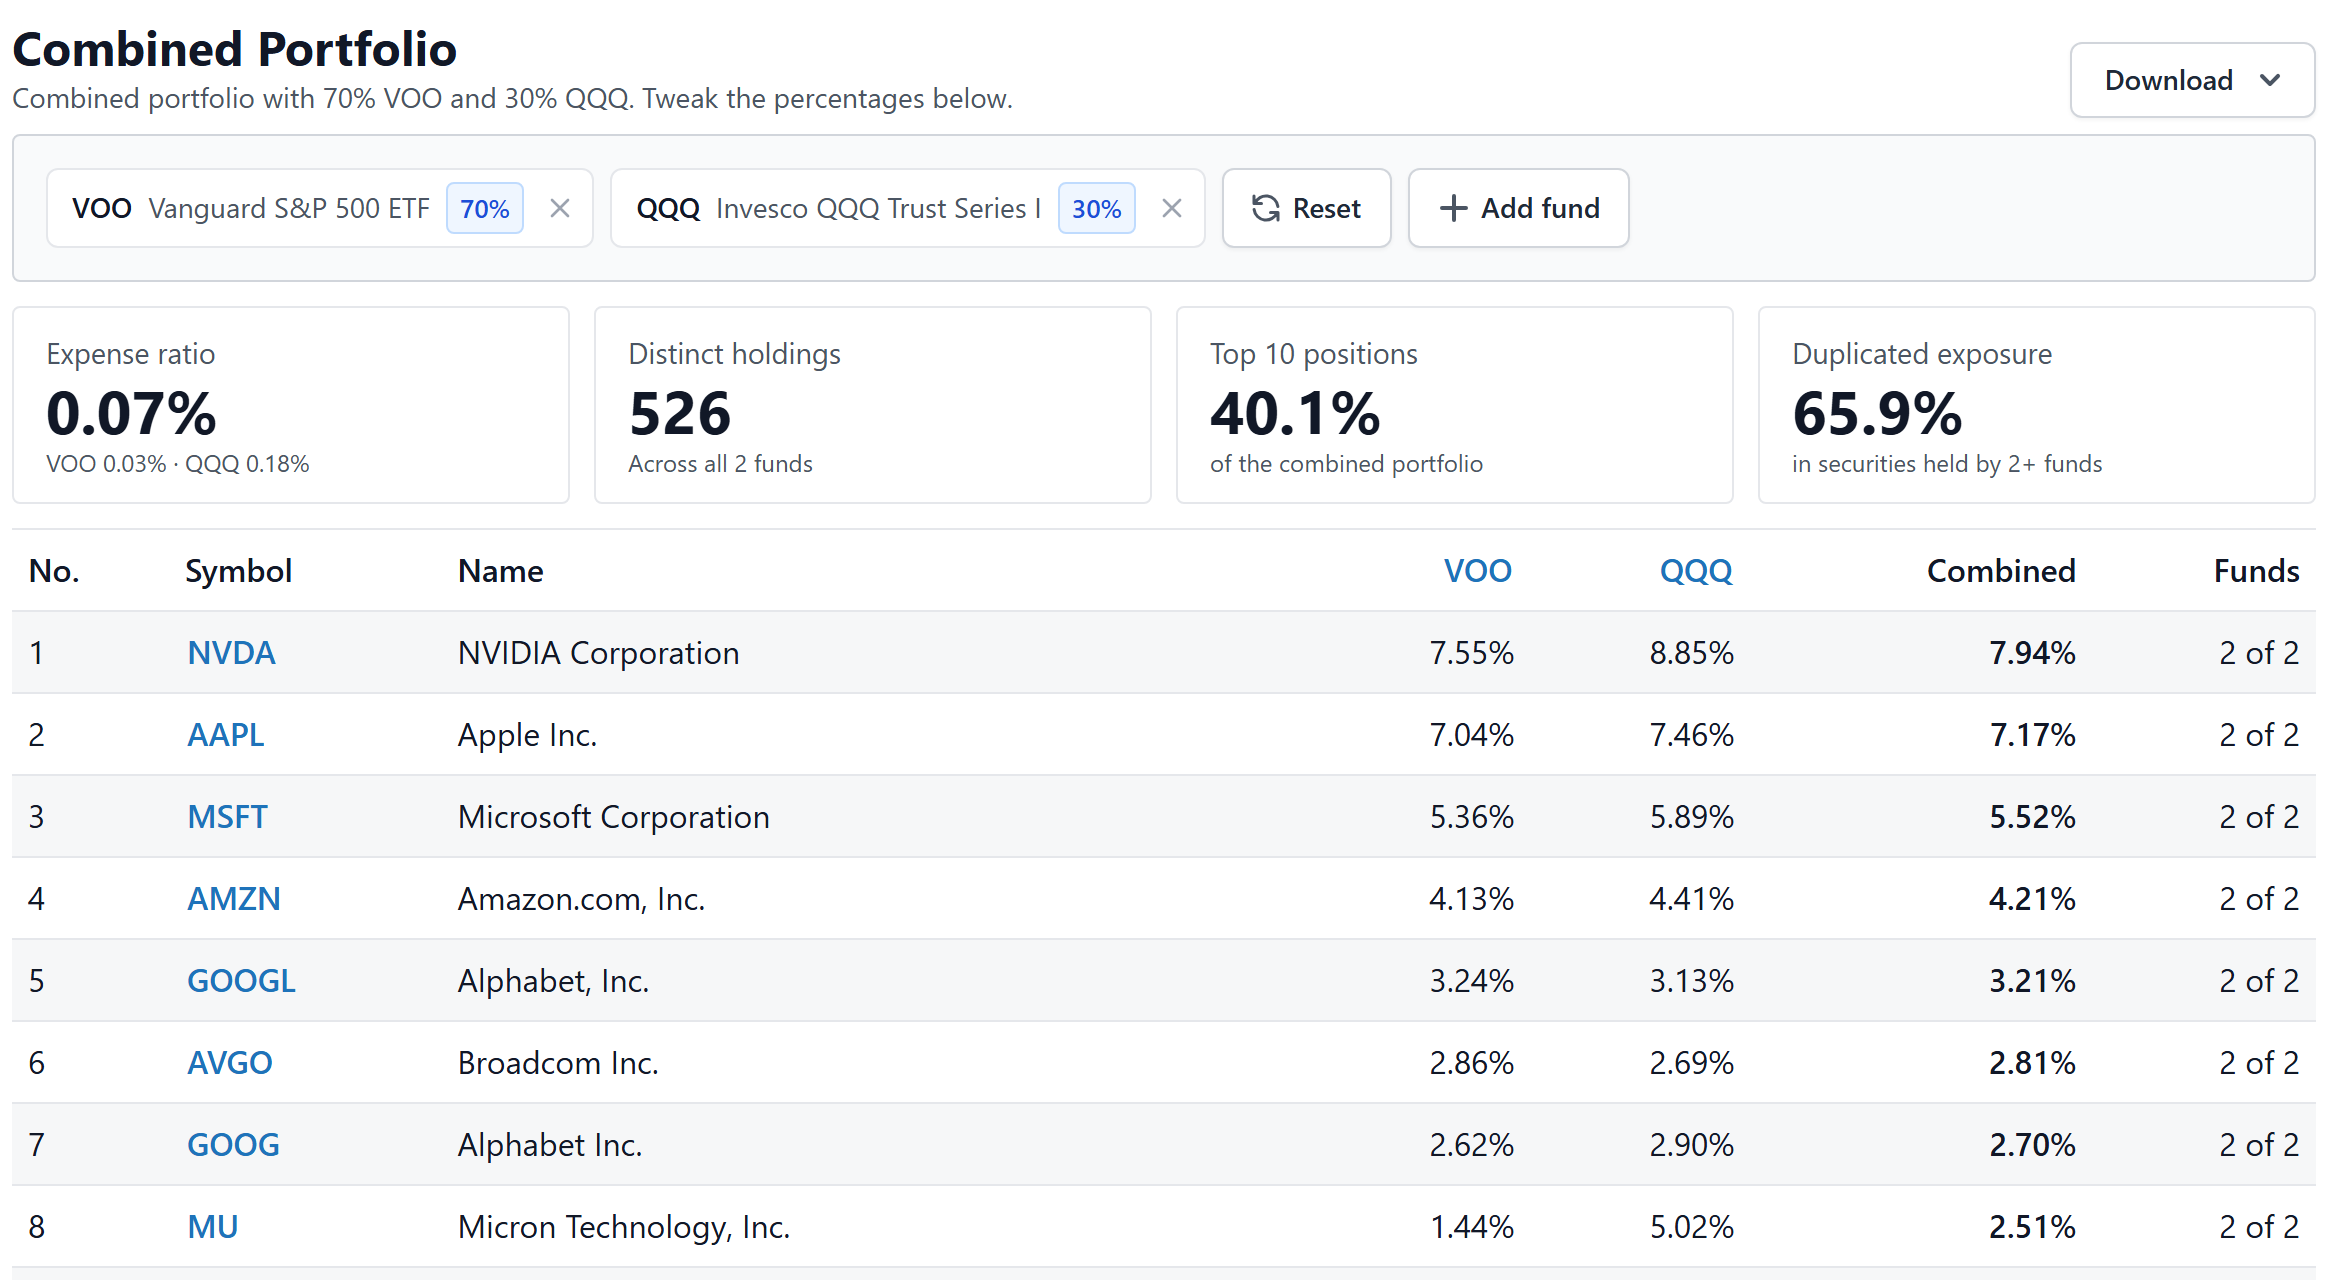
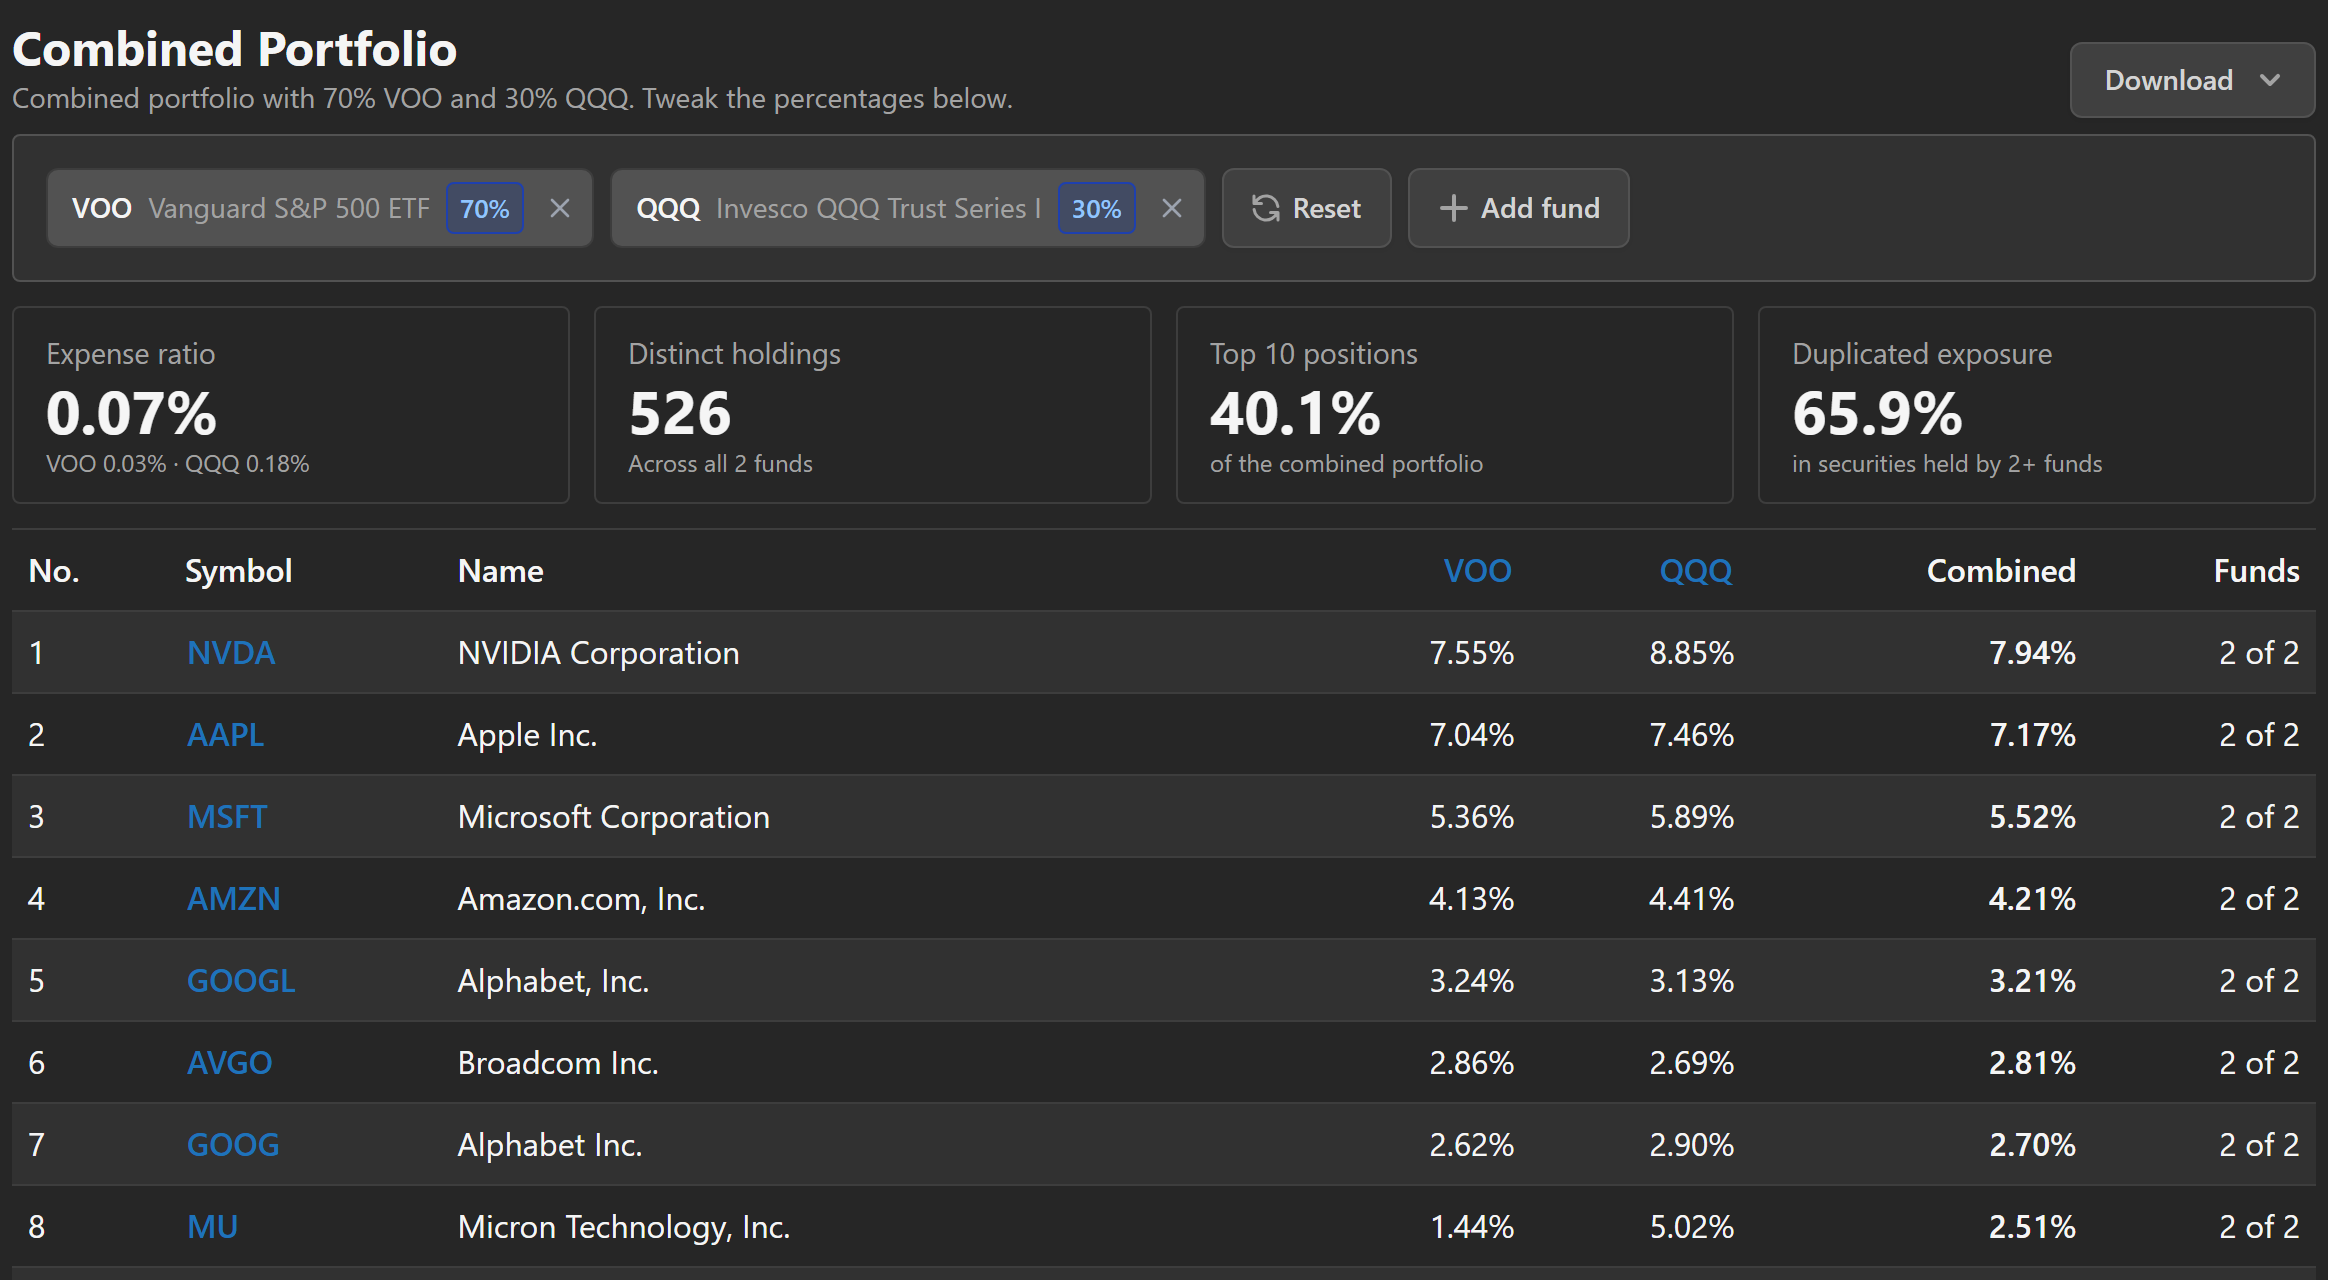
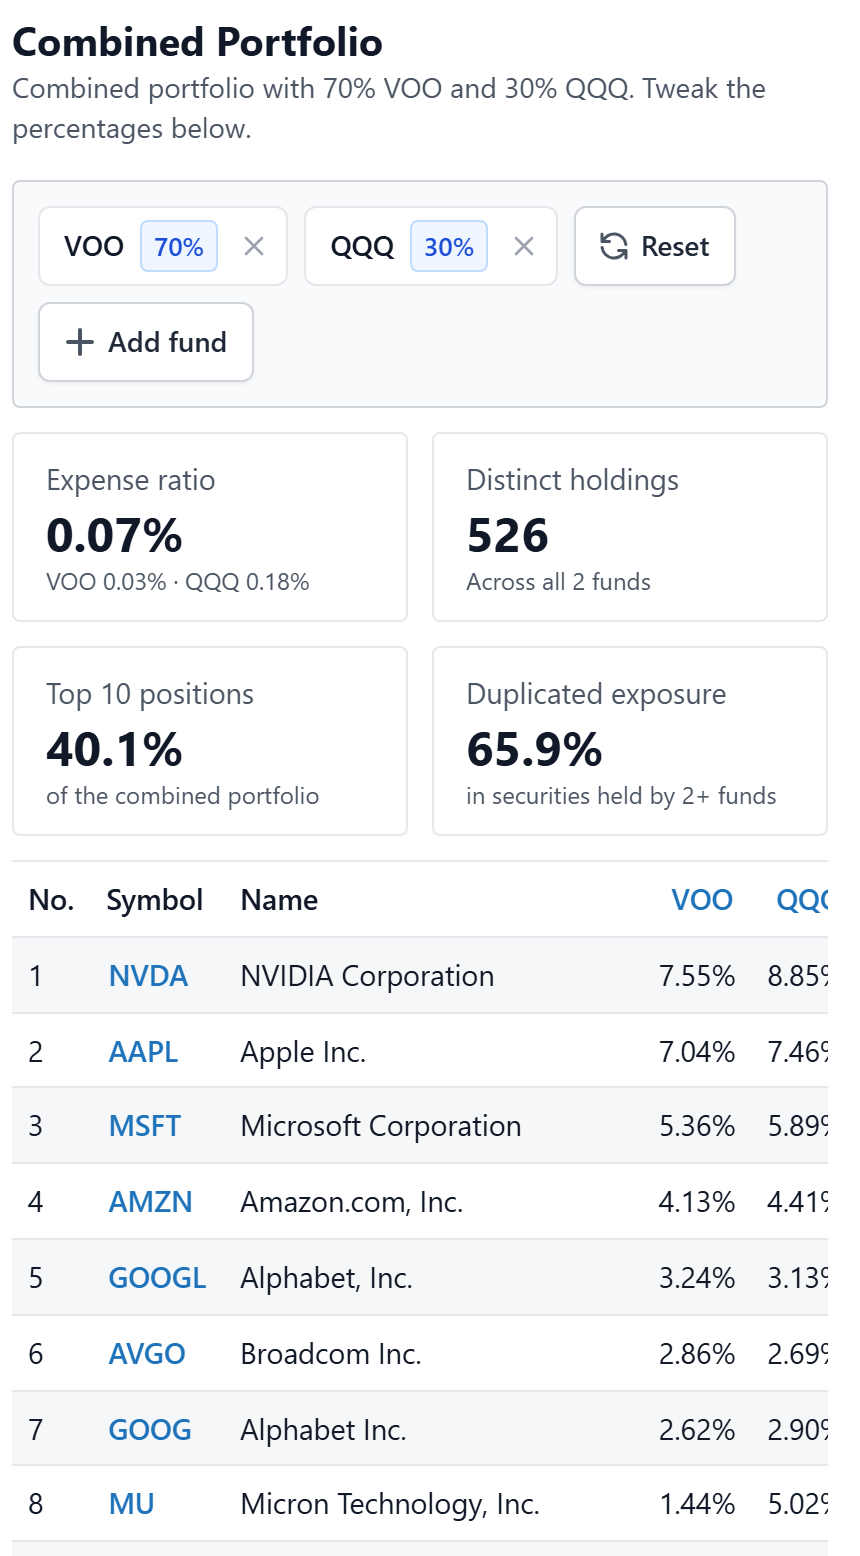
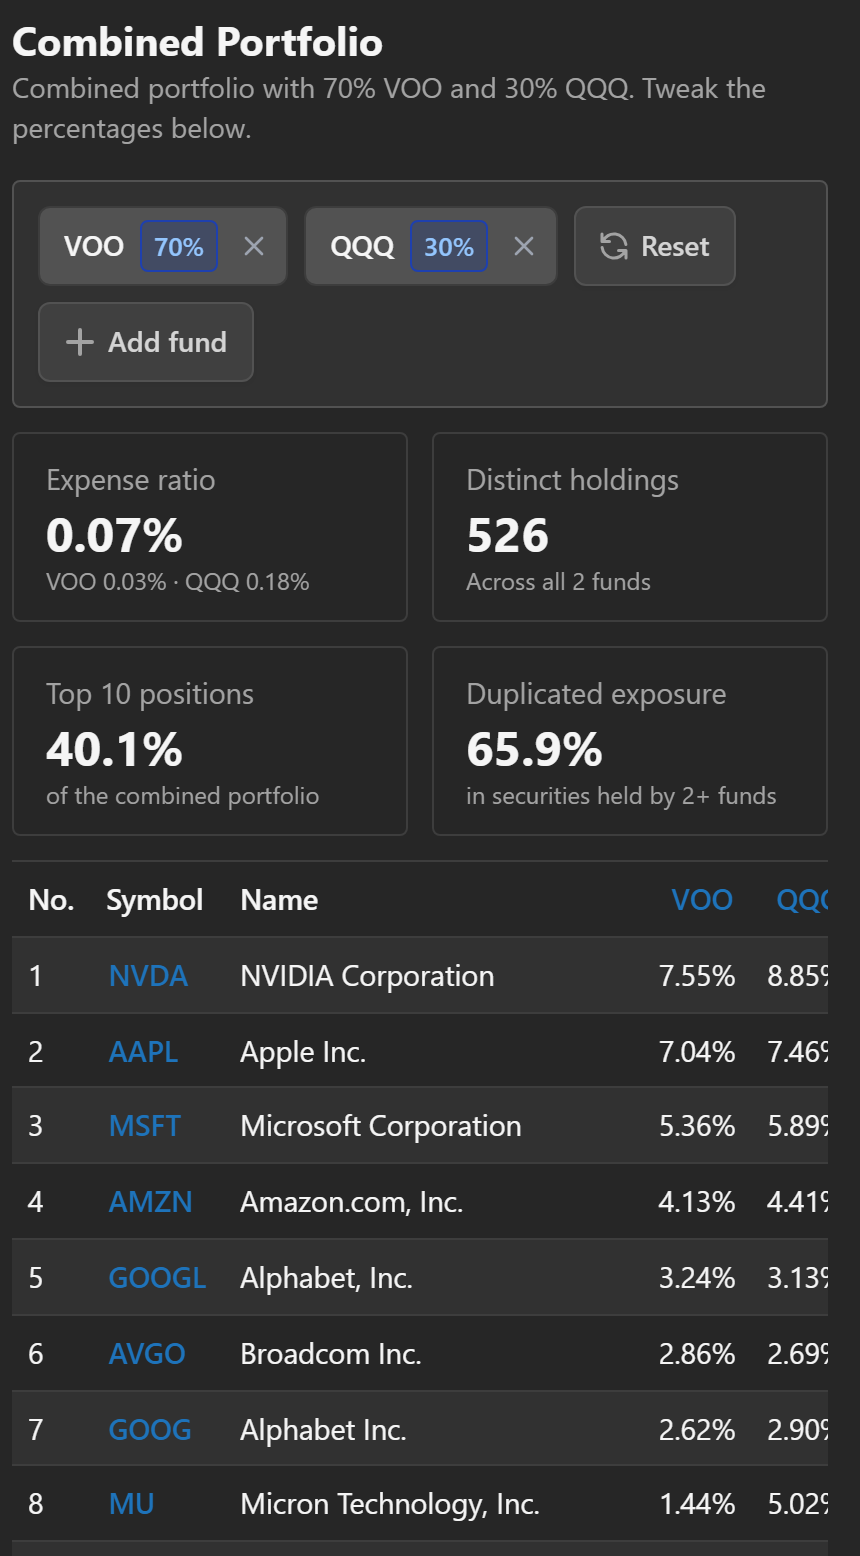
The cards under the funds describe the blend:
- Expense ratio is the fee you'd pay on the mix, with each fund's own fee underneath.
- Distinct holdings is how many different securities you'd own across both funds.
- Top 10 positions is the share of the blend sitting in its ten largest positions.
- Duplicated exposure is the share of the blend in securities that two or more of the funds hold.
The table below them lists the blend's top holdings: each fund's weight, the combined weight, and how many of the funds hold each one. That's where you read off that NVDA is 8% of a 60/40 mix of VOO and QQQ. Everyone sees the top 20; with Pro, Show all pages through the whole blend 50 rows at a time. The Add fund button next to the funds brings another one into the comparison without scrolling back up, and while the split is uneven a Reset button takes you back to the even split.
Compare more than two funds
Keep adding funds, up to eight. The summary switches to the average overlap across every pair, the number of holdings every fund shares, and the most and least similar pairs. The Venn diagram becomes a matrix with the overlap by weight for each pair, shaded darker the higher it is.


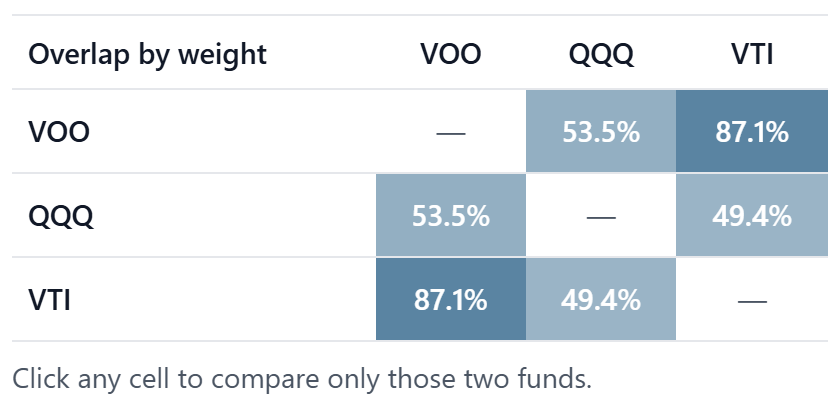
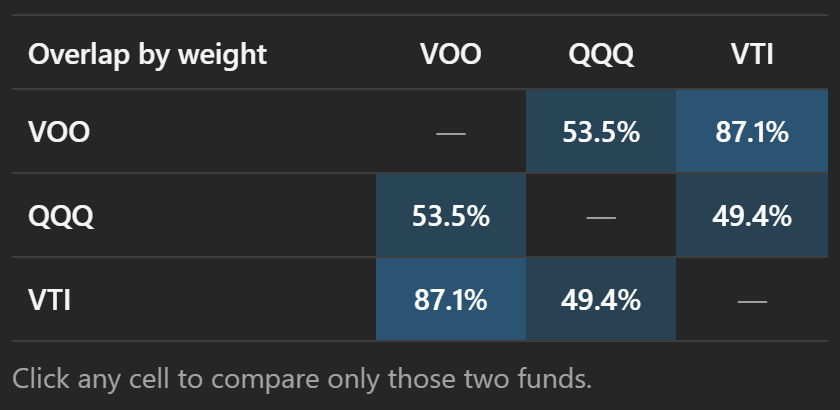
ClickTap any cell to open that pair on its own. The holdings dropdown gains an In some funds list for securities held by two or more funds but not all of them, and the Combined Portfolio blends all of them. With three or more funds the weight boxes don't adjust each other: type the exact percentage for each fund and clicktap Save once they add up to 100.
Fund details
The table at the bottom lines up the funds themselves: type, category, issuer, the index tracked, assets, expense ratio, dividend yield, how many holdings each list contains, and the date the holdings are from. Click a fund's holdings count to open its full holdings page.
Keep in mind that the two dates can differ. Funds publish holdings on their own schedules, so one list may be a month newer than the other.
Download a list
With Stock Analysis Pro, the Download button above the table saves the current list to Excel, CSV or Google Sheets.
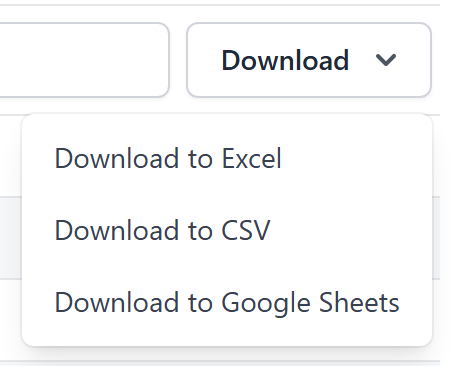
The file matches the list you're on and the sort order you've set, with a column per fund plus the overlap weight. Pick another list from the dropdown to export it.
The Combined Portfolio table has its own Download button for the full blended list.
Share your comparison
The funds live in the page address: ?funds=VOO,QQQ. Copy the URL from your browser and whoever opens it
sees the same comparison. Bookmarks work the same way. The allocation isn't part of the address, so a shared link
opens with an equal split.
How the overlap is calculated
Each fund's complete holdings list is matched security by security. For every security both funds hold, the tool takes the smaller of the two weights and adds those minimums up. That total is the overlap by weight: the share of a portfolio that is duplicated between the funds. If Apple is 7% of one fund and 6% of the other, it contributes 6%.
Weights are used exactly as the funds disclose them and are not rescaled to 100%, so a fund holding 2% cash tops out at 98%. Different share classes of the same company, like GOOGL and GOOG, count as separate securities, and holdings without a ticker (bonds, cash, swaps) are matched by name. Sector and country overlap apply the same minimum rule to the funds' allocation breakdowns.
Overlap is not correlation. Two funds with little overlap can still move together if they're exposed to the same sectors or factors, which is why the sector table sits next to the holdings.
A few finishing tips
- Nearly every fund with a published holdings list can be compared: US and non-US ETFs, mutual funds, closed-end funds and ETNs. If a ticker returns "No holdings data", the fund hasn't published a list we can use.
- Holdings are refreshed regularly, but the overlap can differ slightly from other sites because of different snapshot dates or how cash and derivatives are treated.
- A high overlap isn't automatically bad. Two S&P 500 funds should overlap almost completely; the question is whether you meant to own the same thing twice.
- On big monitors, Pro users can stretch the page with the full-width toggle next to the page title.
That's the whole tool. If a fund you expected is missing, or a number looks off, let us know. We read every message.