Screener Tutorial
Our screener tools make it easy for you to find stocks and funds that match the exact characteristics that you are interested in.
We currently have three screeners:
- Stock screener - For common stocks
- ETF screener - For ETFs
- IPO screener - For upcoming IPOs
This tutorial uses the stock screener, but the ETF and IPO screener work the same way.
The stock screener tool is very powerful. It has over 200 unique indicators and the results update in real-time as you set the filters to the exact values you want.
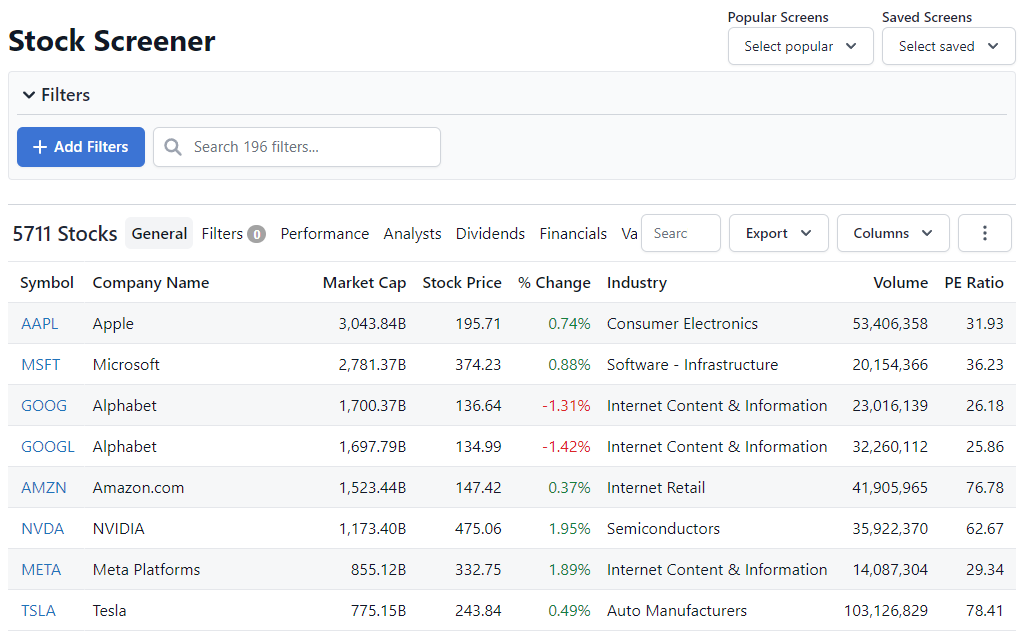
Here's what the screener looks like:
Trading Country
A good starting point is to select the trading country. By default, the screener is set to show stocks that trade on the main stock exchanges in the United States.
If you are primarily interested in stocks trading in a different country, then click the country dropdown and select the country you are interested in.
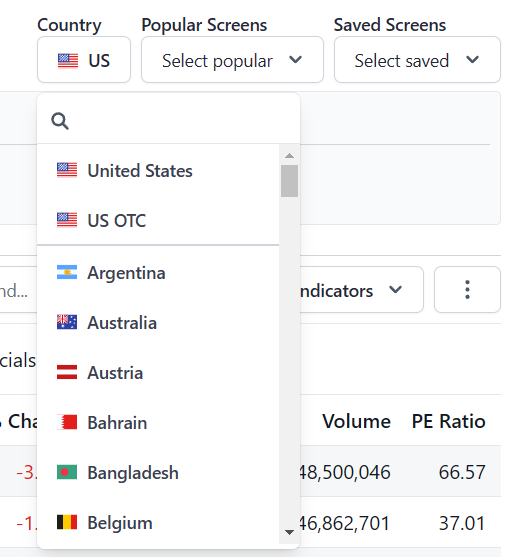
You can either scroll down the list or use the search box at the top of the dropdown to find the country you are interested in quickly.
Keep in mind that stocks that are not listed in the US have fewer available data points because some of our data providers do not offer these data points for non-US stocks.
Also, the ETF screener only shows countries that have ETFs listed. So there are fewer countries available than in the stock screener.
How to add filters
A "filter" is an indicator that you use to narrow down the list of stocks to what you are looking for. For example, PE Ratio, Market Cap or Industry.
There are two main ways to add a filter:
- Search for a filter using the search box (fast!)
- Click the blue "+ Add Filters" button
Finding a filter using the search box is fastest. Just start typing and the screener will instantly suggest indicators that match your words.
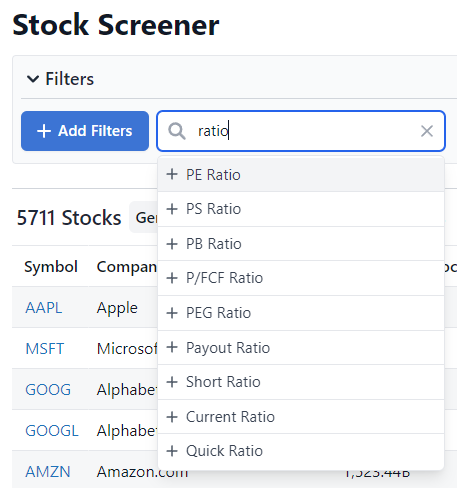
After you click a filter from the list, it will show up right below.
How to set the filter value
The next step is to set the filter to a value. This is how it looks for numeric filters like the PE ratio:
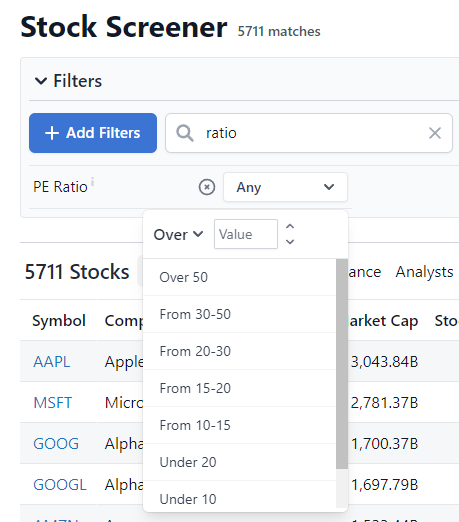
The most important part is the top part, where it says "Over" and then an input box and up/down arrows:
- You can click "Over" to change it to Under, Between, Exactly or Not Zero.
- Then you put the exact value that you are looking for in the input box.
- You can change the value in the input box or click the up and down arrows.
if you are working with large numbers, you can also add K, M or B to the end of the numbers in the input box. For example, 10B will match 10 billion.
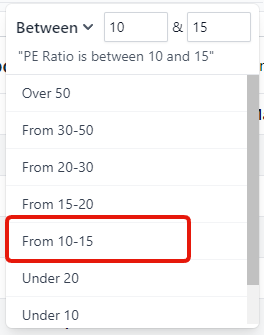
Most of the filters also have a list of preset values that you can choose (and then customize using the input box if you want):
How to see all available filters
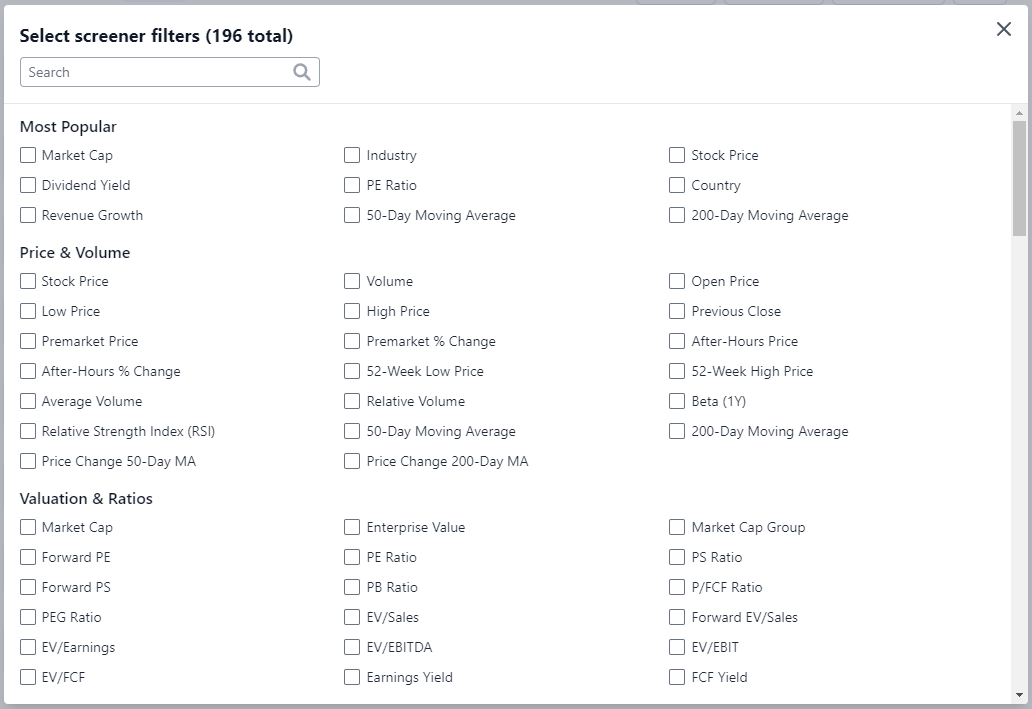
If you want to see a list of all the available filters, then click the blue "+ Add Filters" button.
This will show all of the available filters. You can narrow them down using the search box.
Click the checkbox next to each filter to apply it, then close the dialog box and set the filter values.
Reset filters
To reset a filter, click the icon next to the filter dropdown.
To remove it completely, click the icon next to the filter dropdown.
If the filter has a value, you need to click twice. First the icon and then the icon.
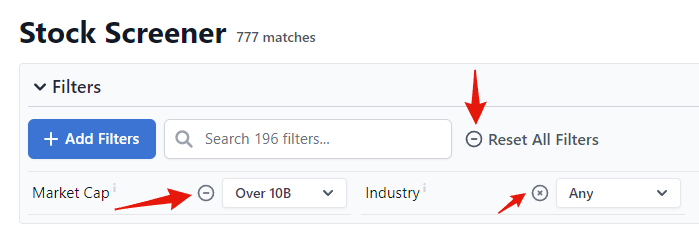
You can also reset/remove all the filters by clicking "Reset All Filters" or "Remove All Filters."
Other filter types
The numeric filter was described above, but there are several more types of filters.
1. Select filters
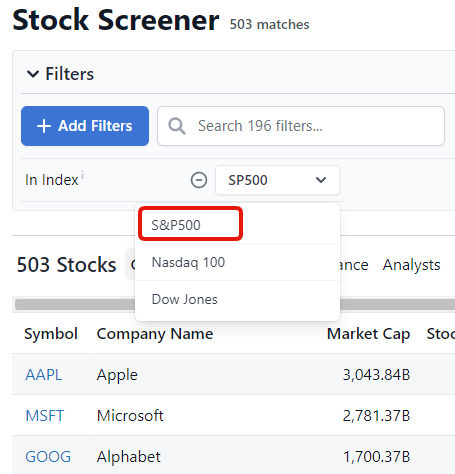
Here you can filter the stocks by one value at a time. For example, the "In Index" filter allows you to show only stocks in the S&P500 index, Nasdaq 100 or the Dow Jones Industrial Average:
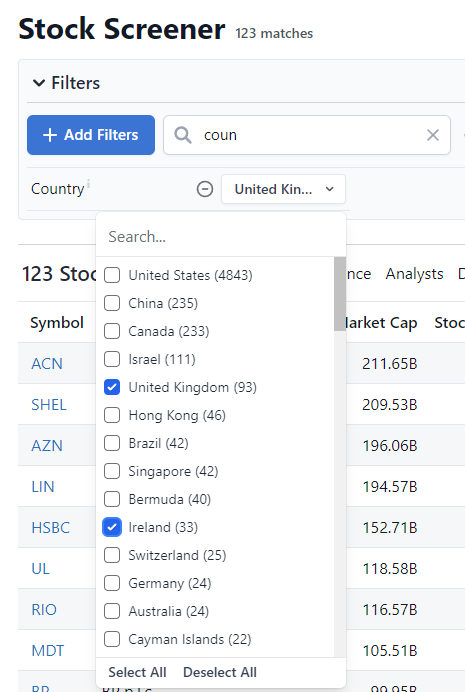
2. Multi-select filters
Here you can choose one or more values from a list of options. You can narrow down the list using the search box or click "Select All" or "Deselect All".
Examples include Country, Industry, Sector and Exchange.
3. Date filters
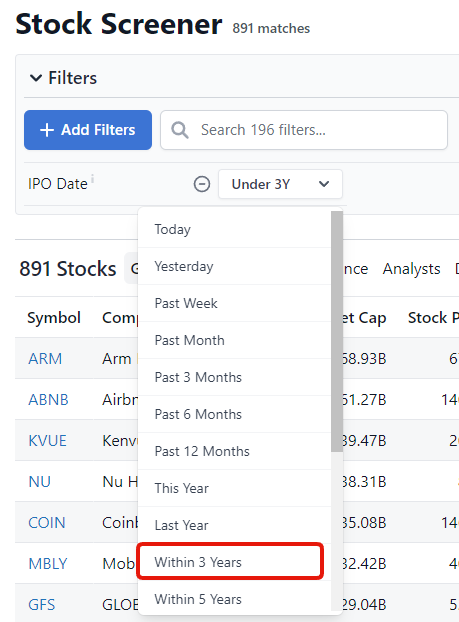
Some filters are based on a date, such as the IPO Date or Ex-Dividend Date.
Filter definitions and formulas
You can see exactly how a filter/indicator is defined by hovering over the "i" icon next to the title.
The "i" icon is found in the filters list, as well as in the table column headers when you hover over them.
Change your views
The screener allows you to change the data points that are showing for the filtered stocks.

There are 7 views:
- General
- Filters - shows the values for the filters you have added
- Performance
- Analysts
- Dividends
- Financials
- Valuation
Change data points in view
It is also possible change the data points for each view by clicking the "Columns" button above the table.
These settings will be remembered in your browser for when you return to the screener.
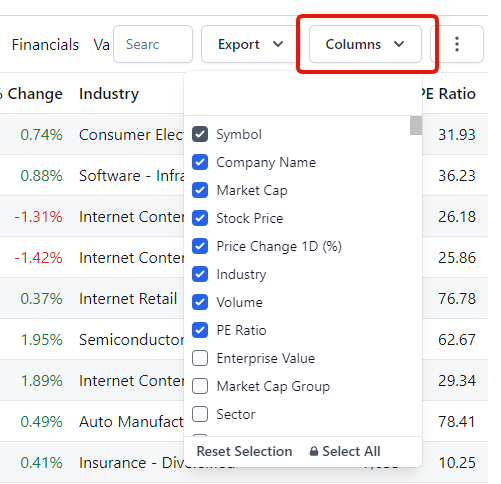
Keep in mind that changes to the columns in the "Filters" view will not be persisted in your browser. These change depending on what filters you add.
Reset views
You can reset a single view by toggling that view, clicking "Columns" and "Reset Selection."
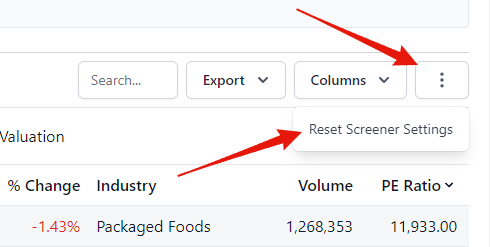
In order to reset all the changes you made to your views, as well as remove all filters added, click the three-dot menu icon above the table and clicking "Reset Screener Settings".
Download
Click the "Download" button to download all the stocks you have filtered to either Excel or CSV files.
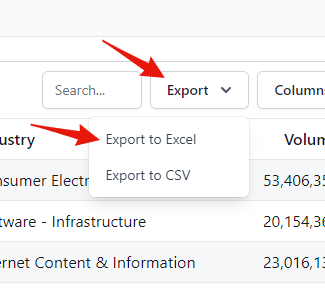
This will download all the stocks you have filtered, with many of the data points in the view you have selected.
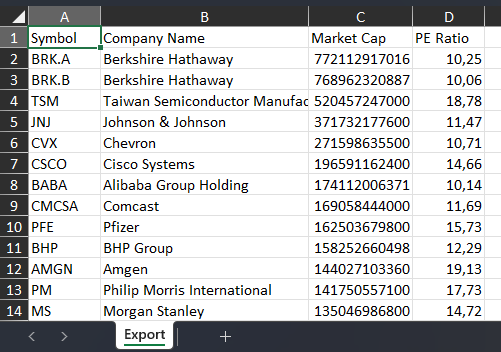
Keep in mind that some columns may not be available for download because of restrictions from our data providers.
Sort
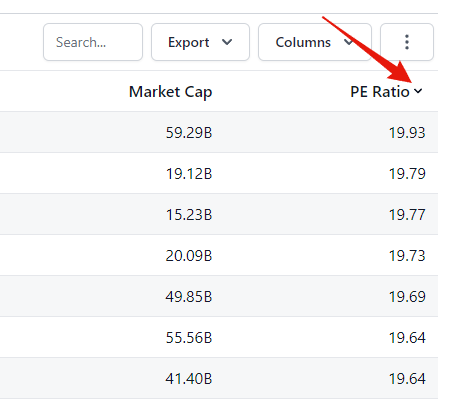
Click the table column header to sort by your indicator. Click multiple times to switch between descending, ascending and no sort.
Search
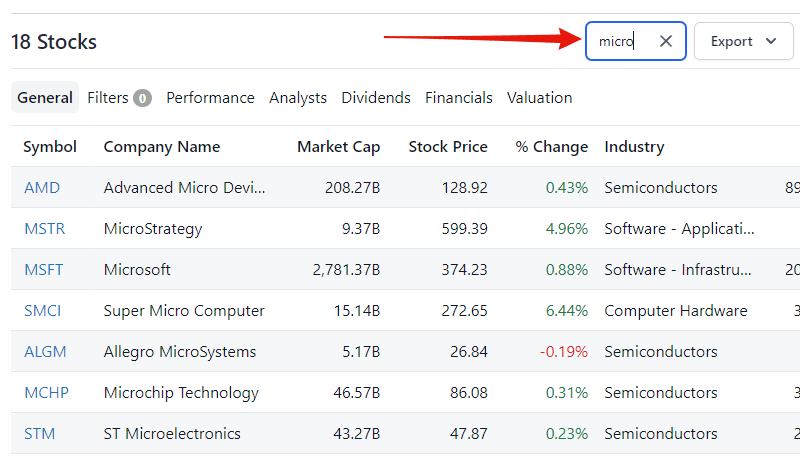
To quickly find a stock within your list of filtered stocks, use the search input box.
Either enter part of the ticker symbol or company name.
View more pages
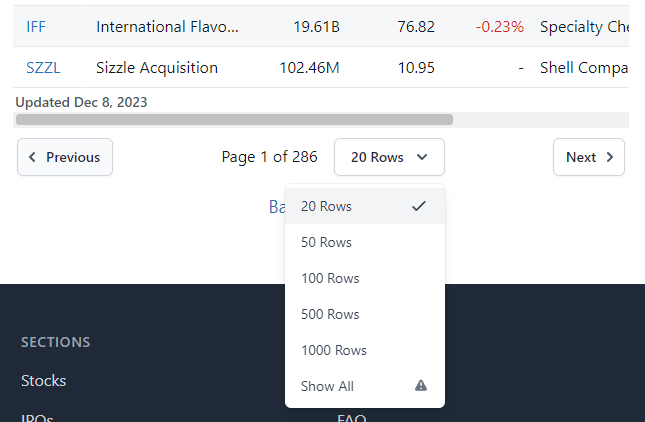
Below the table, you can click the "Next" and "Previous" buttons to go to the next or previous page of results.
Click the dropdown to change how many stocks are shown per page.
Clicking "Show All" shows all the results without needing to click Next/Previous.
Keep in mind that if you have thousands of results, clicking "Show All" can significantly slow down the page.
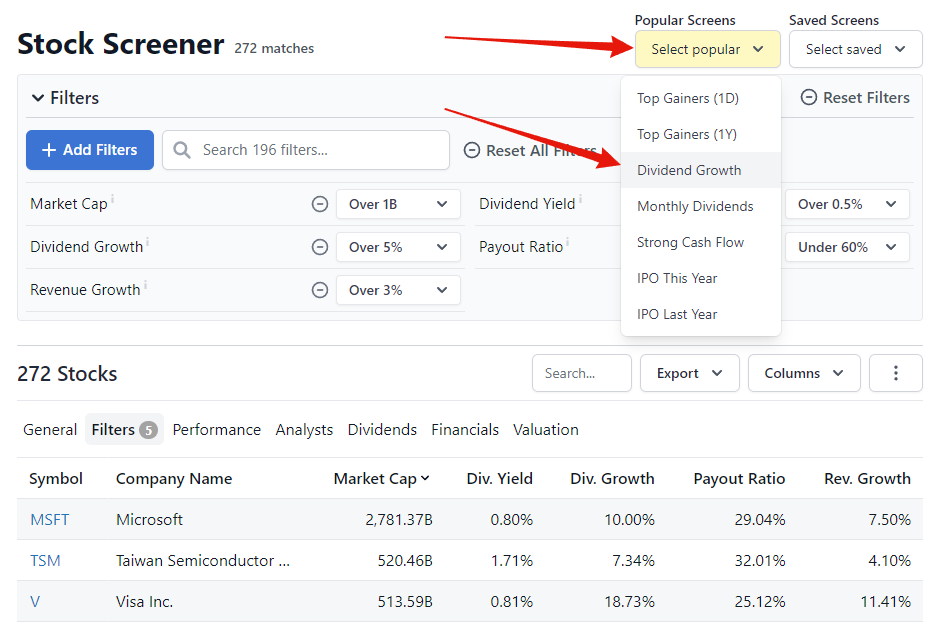
Popular screens
In the "Popular Screens" dropdown, you can toggle sets of popular screens in order to find stocks that match certain characteristics.
For example, you can find "Dividend Growth" stocks or "IPO Last Year" which adds a set of filters that show only these types of stocks.
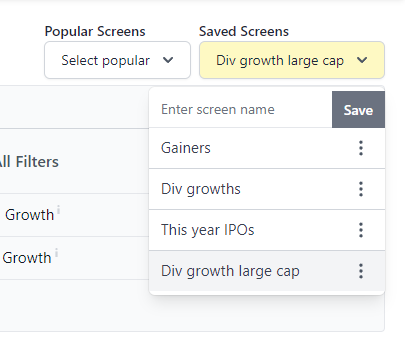
Saved screens
If you have a Stock Analysis Pro account then you can also save your filters.
For example, you might have multiple lists of filters that you want to switch between. Then you can add them as saved screens.
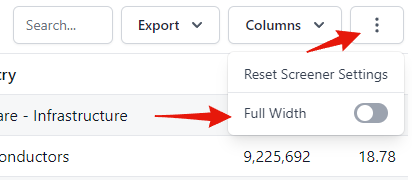
Full Width
On large screens, there is the option to change the screener to fill the width of the monitor.
To enable it, click on the three dot menu icon and then toggle "Full Width."
Open in Screener
Many of the lists and tables on the site have an option to open the results in the stock screener.
For example, if you are looking at the Top Gainers list, which shows the day's best performing stocks, then you can click "Open in Screener" to view those stocks in the stock screener.
This will open up the stock screener page and apply the filters and sorting that are used in the Top Gainers list.
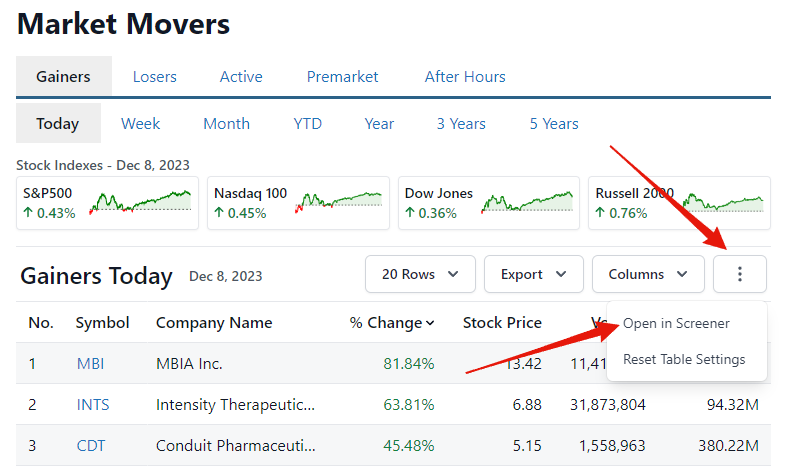
For example, let's say you are interested in the best performing stocks of the day but you only want to see Top Gainers that are in the S&P500.
Then you can go to the Top Gainers page, click "Open In Screener" and add the "In Index" filter.