
9 Charts That Explain the Stock Market

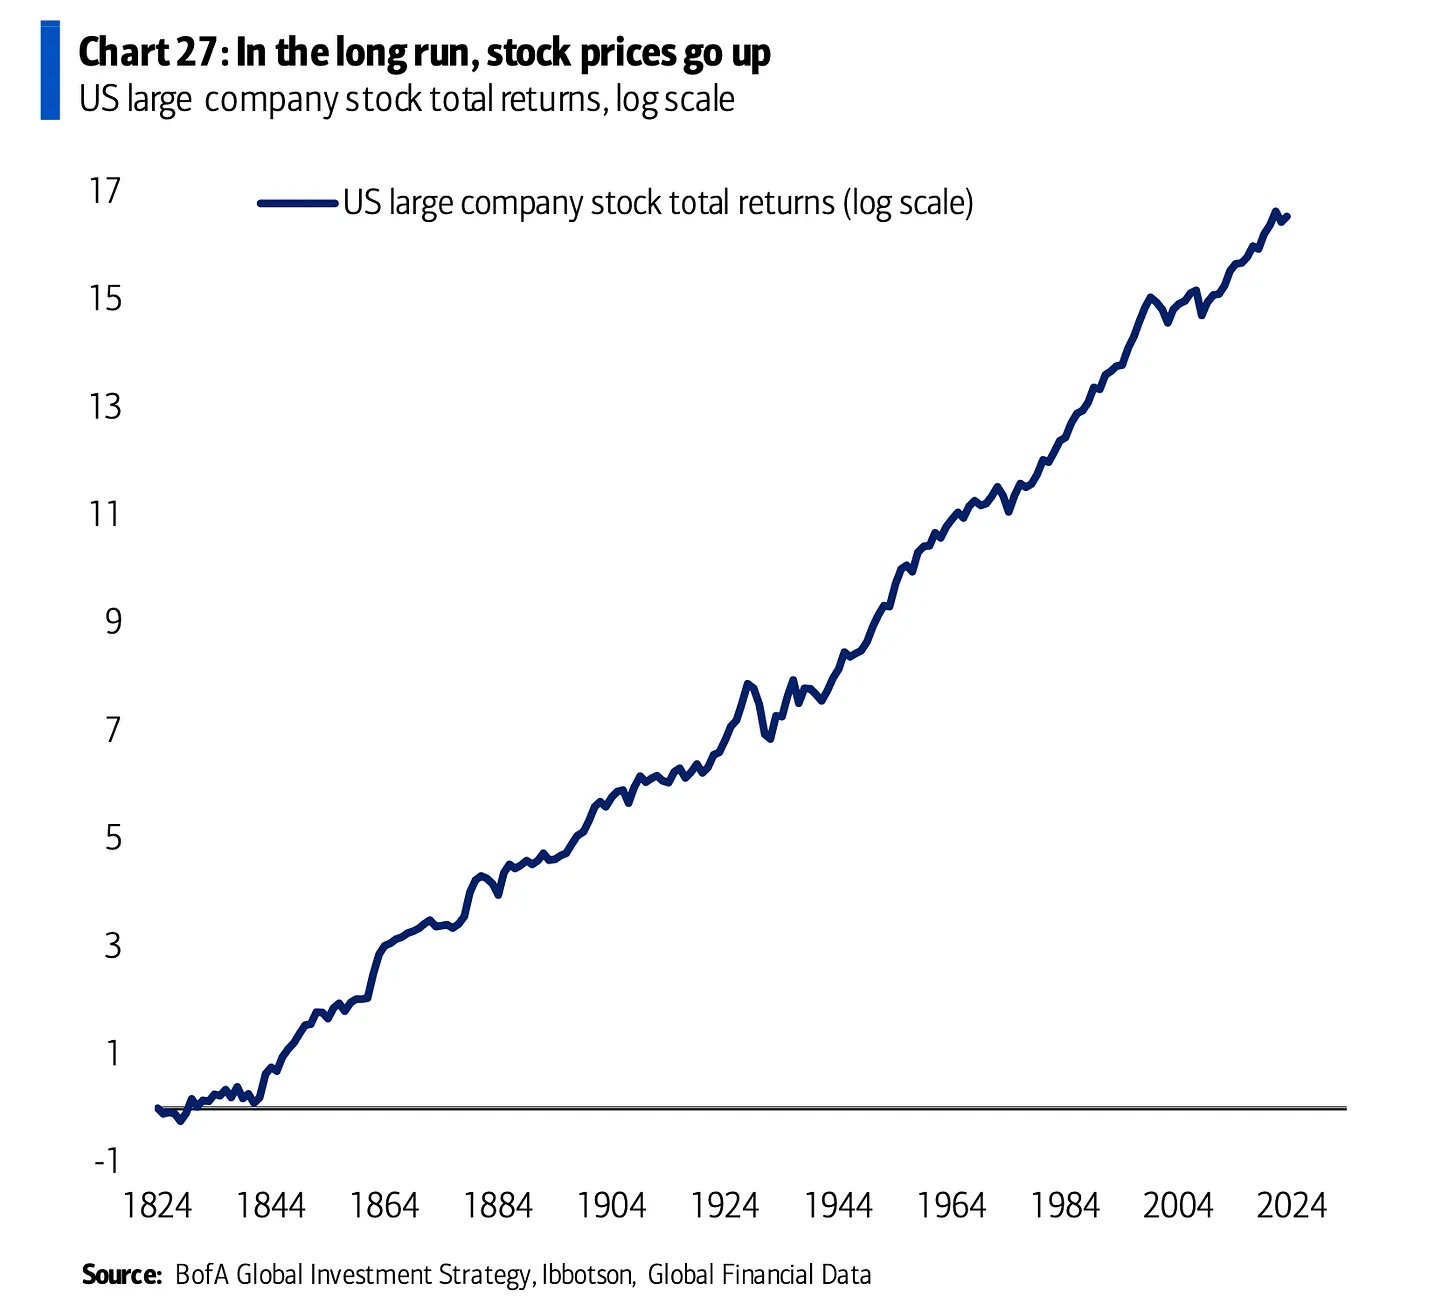
1. The stock market usually goes up
This is why you own stocks.
Source: TKer
Despite wars, recessions, bubbles, pandemics, and political chaos, the stock market has moved in one direction over time: higher.
This isn't by accident. Investing in the stock market is an investment in innovation, productivity gains, people, and companies getting better at turning ideas into profits.
Historically, that's been a good investment to make.
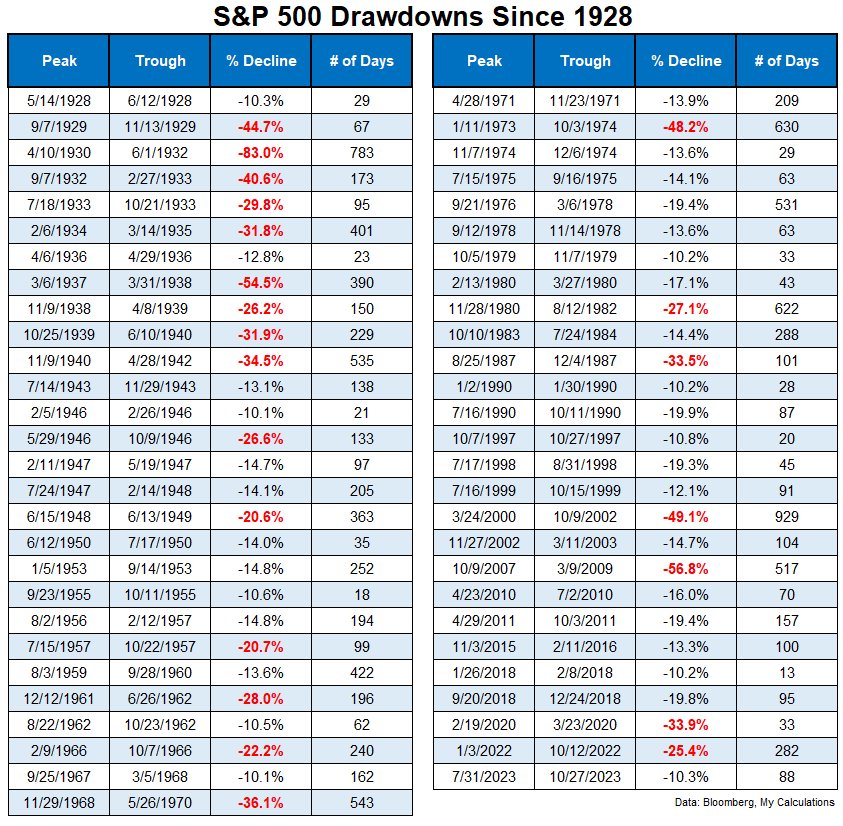
2. Drawdowns are common
While the chart above does a great job of illustrating the long-term trend of the stock market, it's a bit misleading. Yes, the stock market has performed well over the long term, but it can get crushed in the short term.
The Great Depression, Black Monday, the Global Financial Crisis, the Covid Crash, and the nearly 20% drop we had in April 2025 all look like minor blips on that 200+ year logarithmic chart, but they certainly don't feel that way in the moment.
That's why you can't look at the chart above without taking into account the drawdowns that happened along the way:
Source: A Wealth of Common Sense
Notably, the Great Depression (1930–1932) was not a blip. The market dropped -83% and took more than two years to recover.
The Global Financial Crisis (2007–2009) was also not a blip. Stocks fell nearly -57% and didn't recover for nearly eighteen months.
In all, there were 55 corrections (drawdowns of -10% or more) and 22 bear markets (drawdowns of -20% or more, highlighted in red) over this 96-year period.
That means, on average, the U.S. stock market experienced a double-digit correction once every eighteen months and a bear market about every four-and-a-half years.
There's little reason to expect this pattern to change.
Corrections and bear markets will happen. You just don't know when.
The stock market may average a return of 8–10% per year, but that return is rarely delivered smoothly. Instead, it comes through years of sharp gains followed by painful drawdowns.
If it wasn't this way, if stocks were steady and predictable, more investors would stick with them, and long-term returns wouldn't be as high.
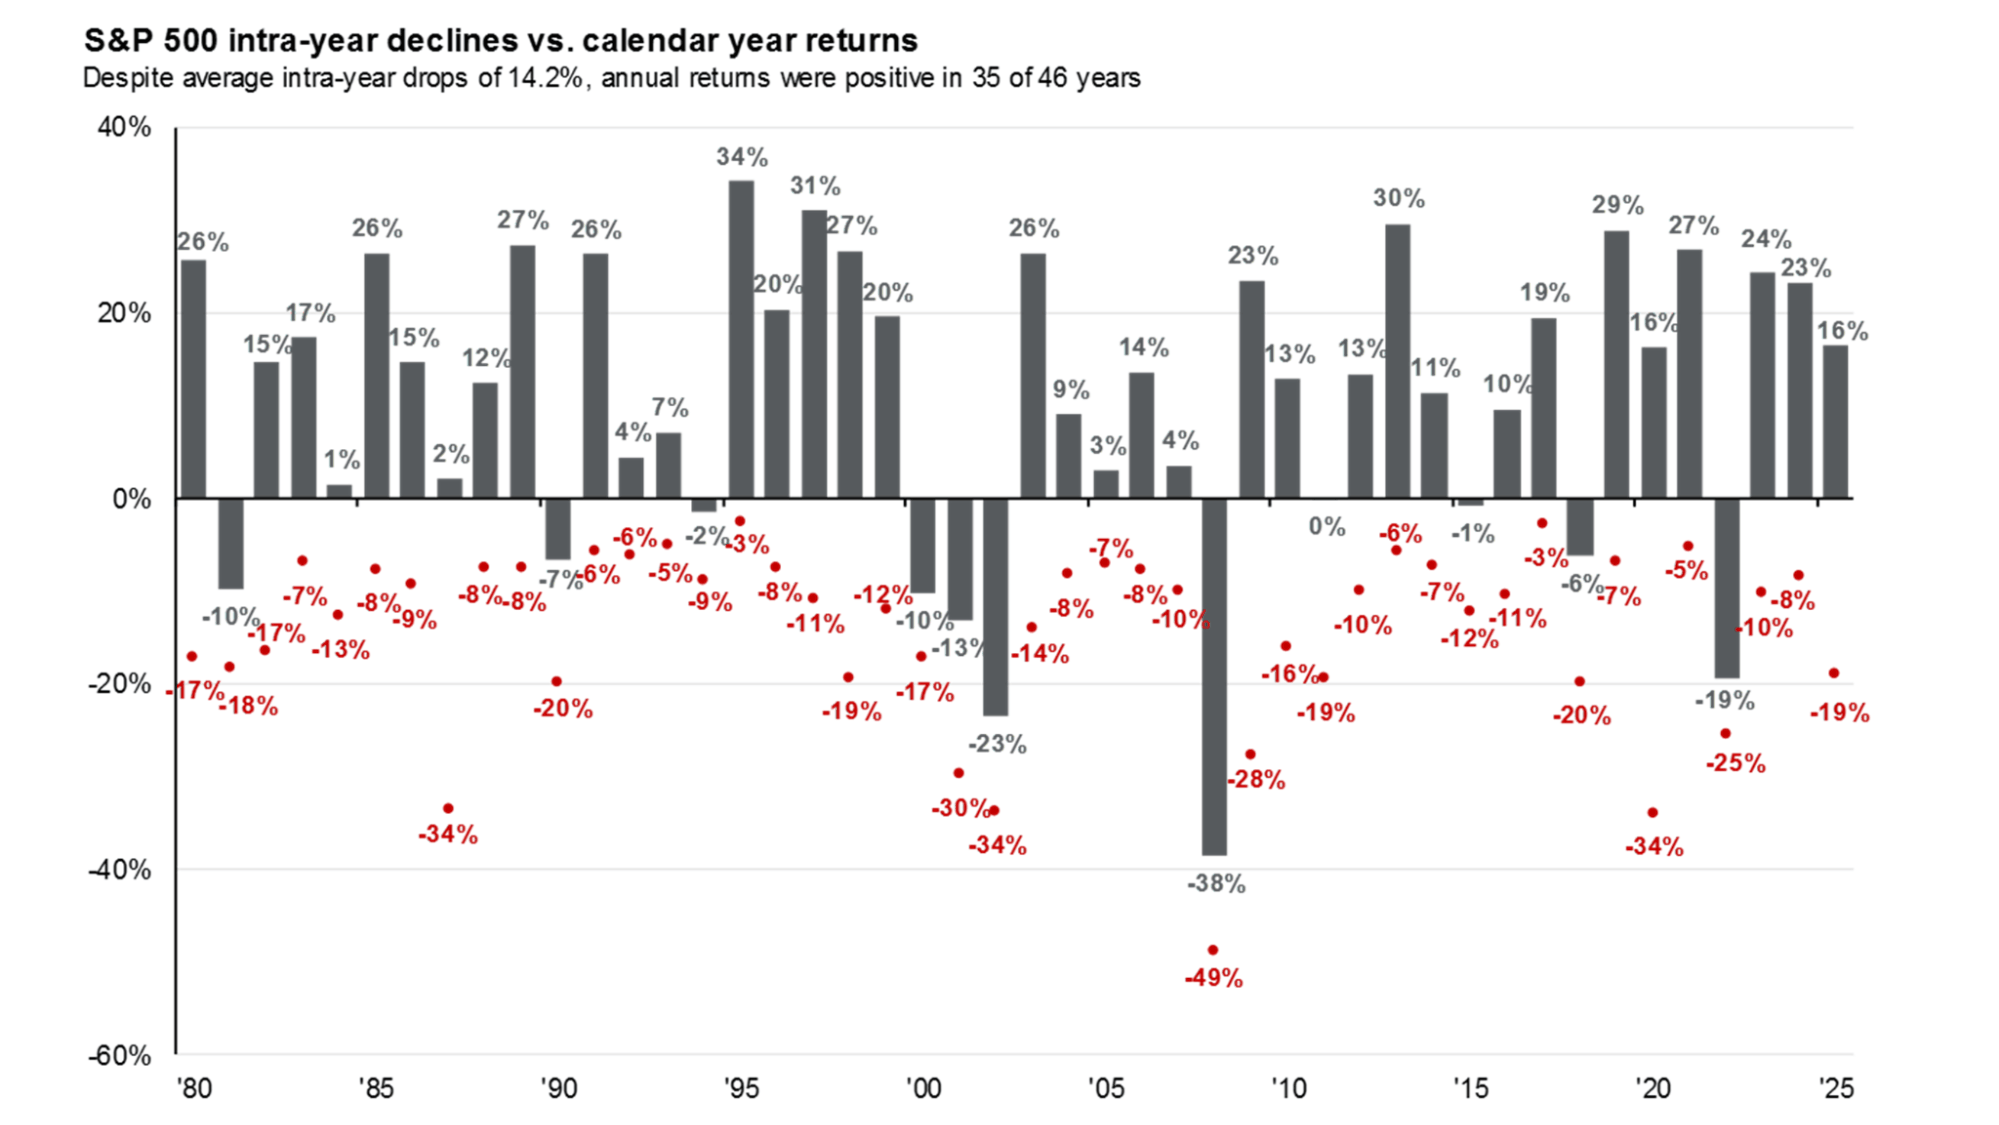
3. Volatility is normal
Zooming in further, stocks can also be volatile on an intra-year basis — even during good years.
Since 1980, the S&P has had an average intra-year drawdown (meaning the largest peak-to-trough decline within a year) of -14.2%:
Source: JP Morgan Asset Management
Not only does this chart above show the volatility of the stock market, but it also shows its resilience. Despite these intra-year drops, the whole-year returns were positive in 35 of 46 years (76% of the time).
In other words, the stock market tends to fall on its way up.
Here's another way to look at the same information:
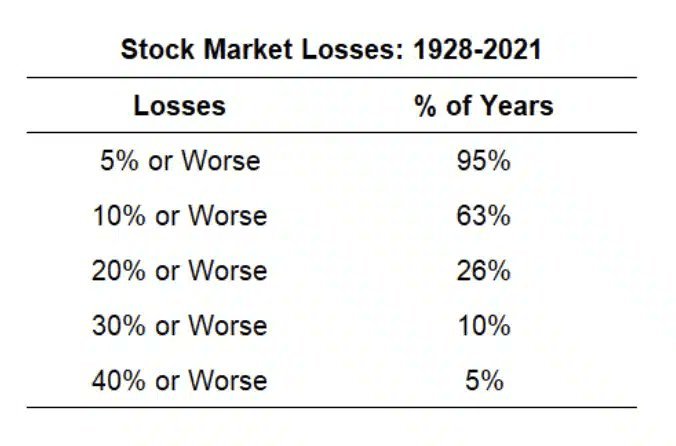
Source: A Wealth of Common Sense
If you're a stock market investor, short-term losses are inevitable. Volatility is the price of admission.
4. There's always a reason to sell
Every year comes with a convincing narrative for why this time is different.
Inflation, interest rates, geopolitics, valuations, elections, technology shifts — there's always a smart-sounding reason to sell your stocks.
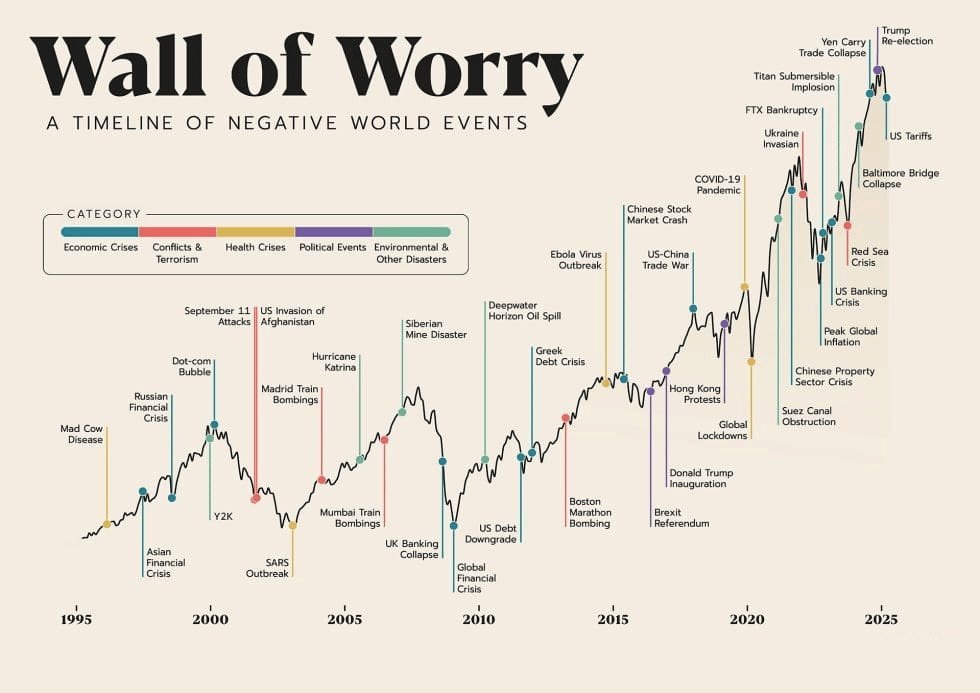
Source: St Barts Finance
The next panic will feel different. It always does. But if you wait for a period where everything feels safe and obvious, you will wait forever.
As the old adage goes, the market climbs a wall of worry, not a staircase of certainty.
5. Stay invested
Many investors sell their stocks when the market becomes volatile. Based on historical data, that's one of the worst things you can do.
The reason is simple: the market's best days tend to cluster around its worst ones. Between 1950 and 2020, the 15 best days for the S&P 500 all occurred during bear markets, precisely when fear is highest and selling feels most justified.
The impact of missing those days is enormous.
An investor who missed just the 10 best days over this period, out of more than 17,500 total trading days, ended with less than half the portfolio value of an investor who stayed fully invested (not including dividends):
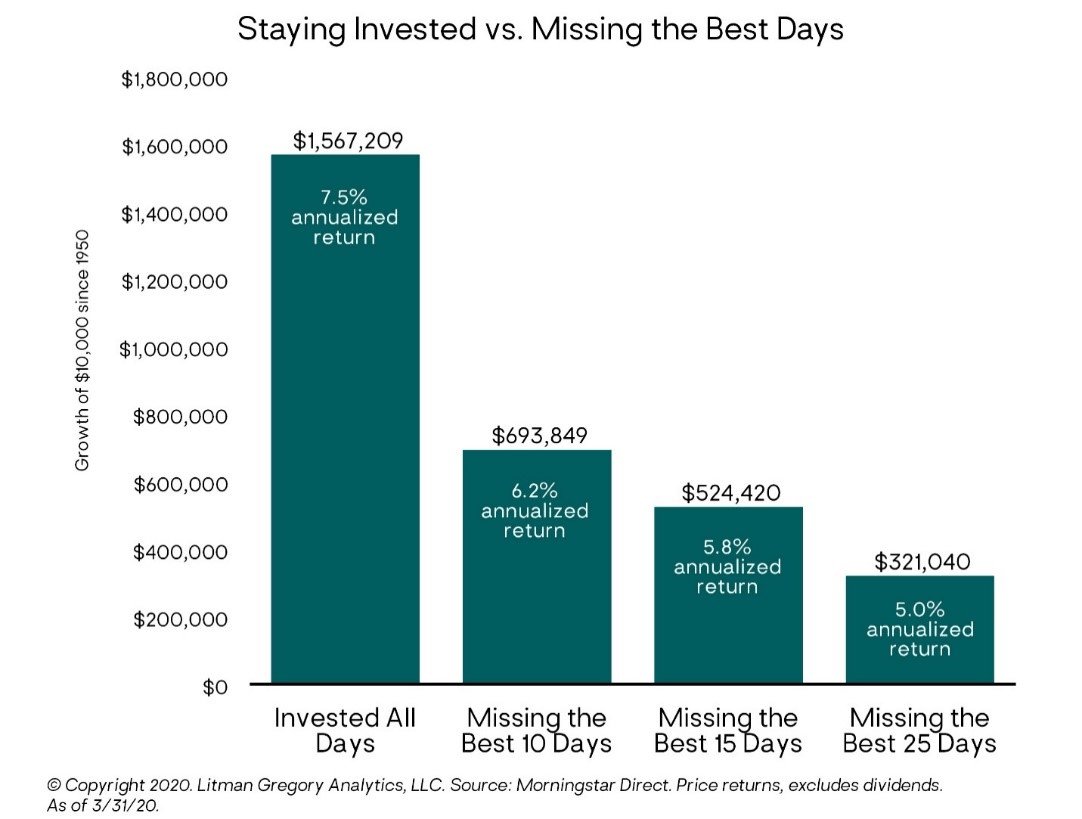
Staying invested isn't about blind optimism. It's about recognizing that the cost of being wrong is far higher than the benefit of being right.
6. Don't fear investing at all-time highs
The market spends a lot of time near all-time highs precisely because it tends to rise over time.
This is especially true during bull markets, where all-time highs are typically followed by more all-time highs:
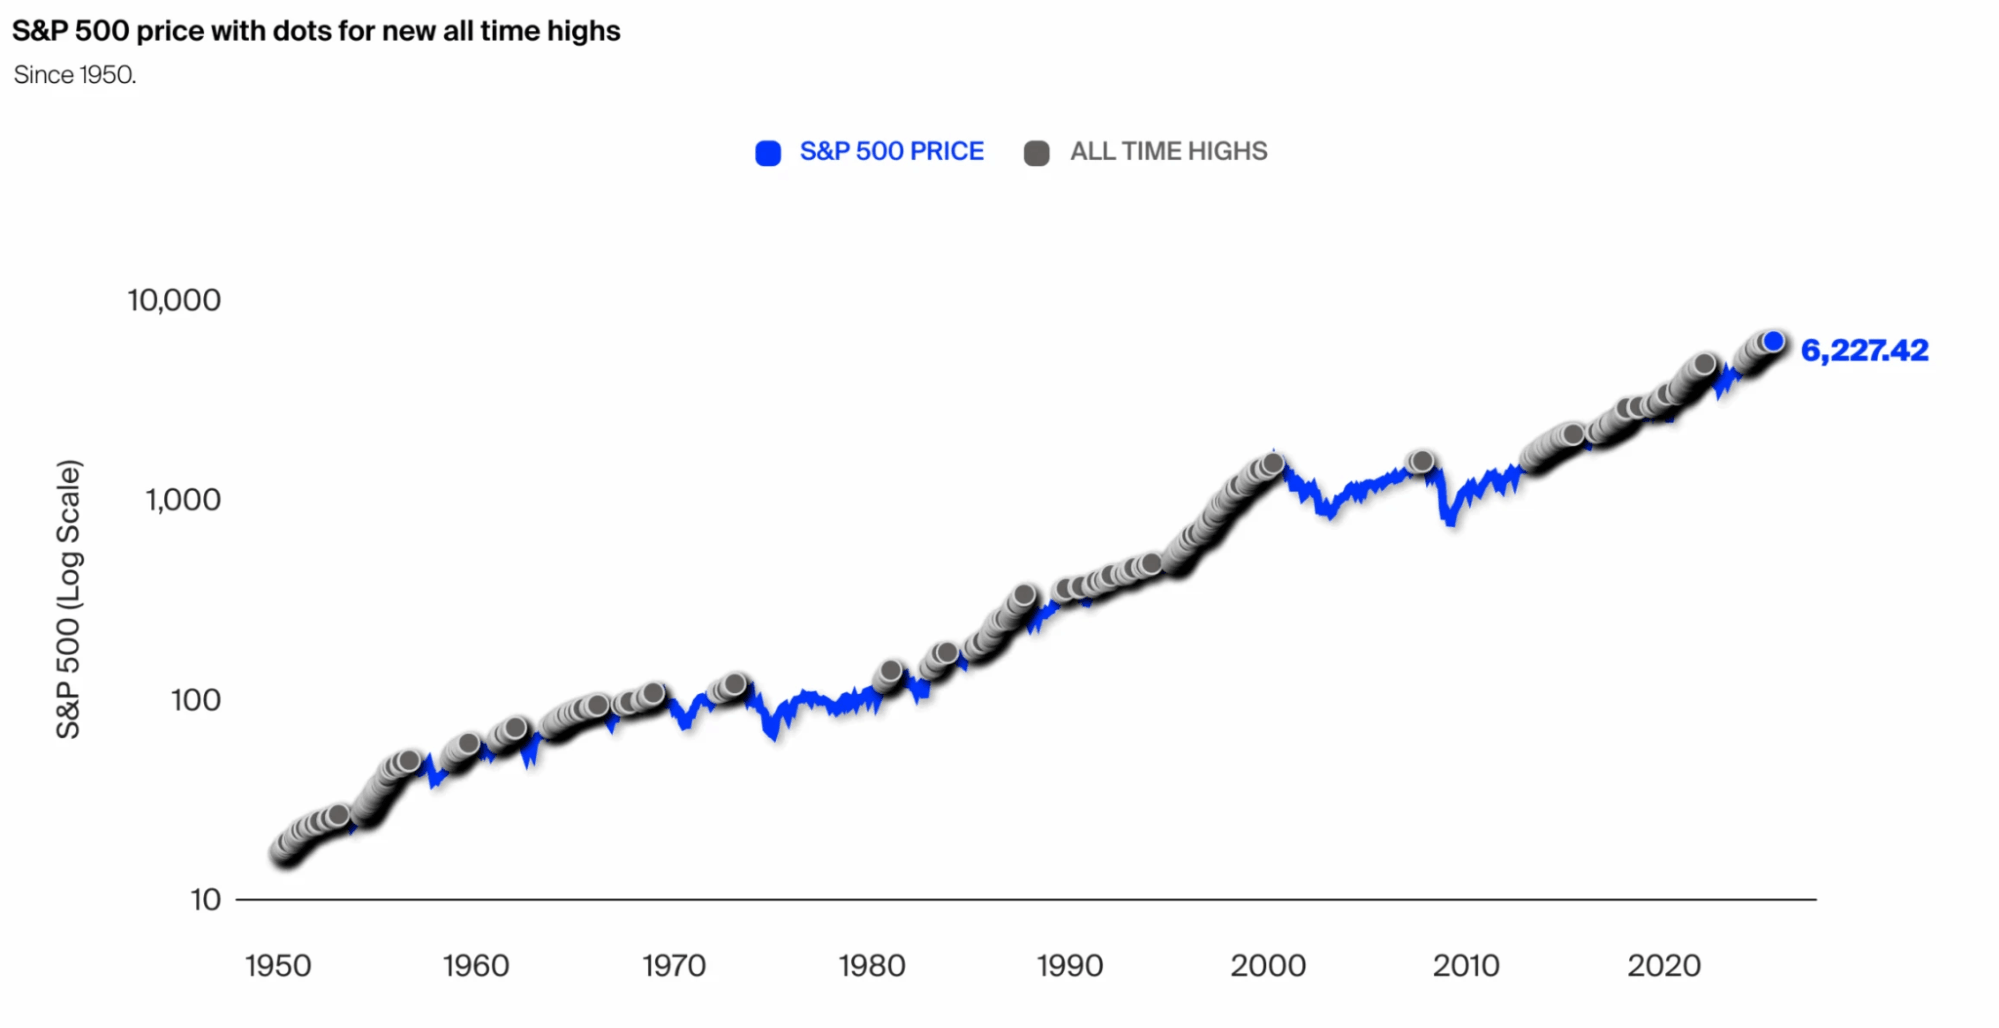
Source: A Wealth of Common Sense
Given that companies are growing and becoming more profitable over time, this is exactly what you should expect from a healthy market. You should expect to see many new highs throughout your lifetime.
Additionally, investing at all-time highs has historically generated higher returns than investing on an average day (right). Furthermore, in nearly 31% of cases since 1950, the market has never fallen below a newly set all-time high (left):
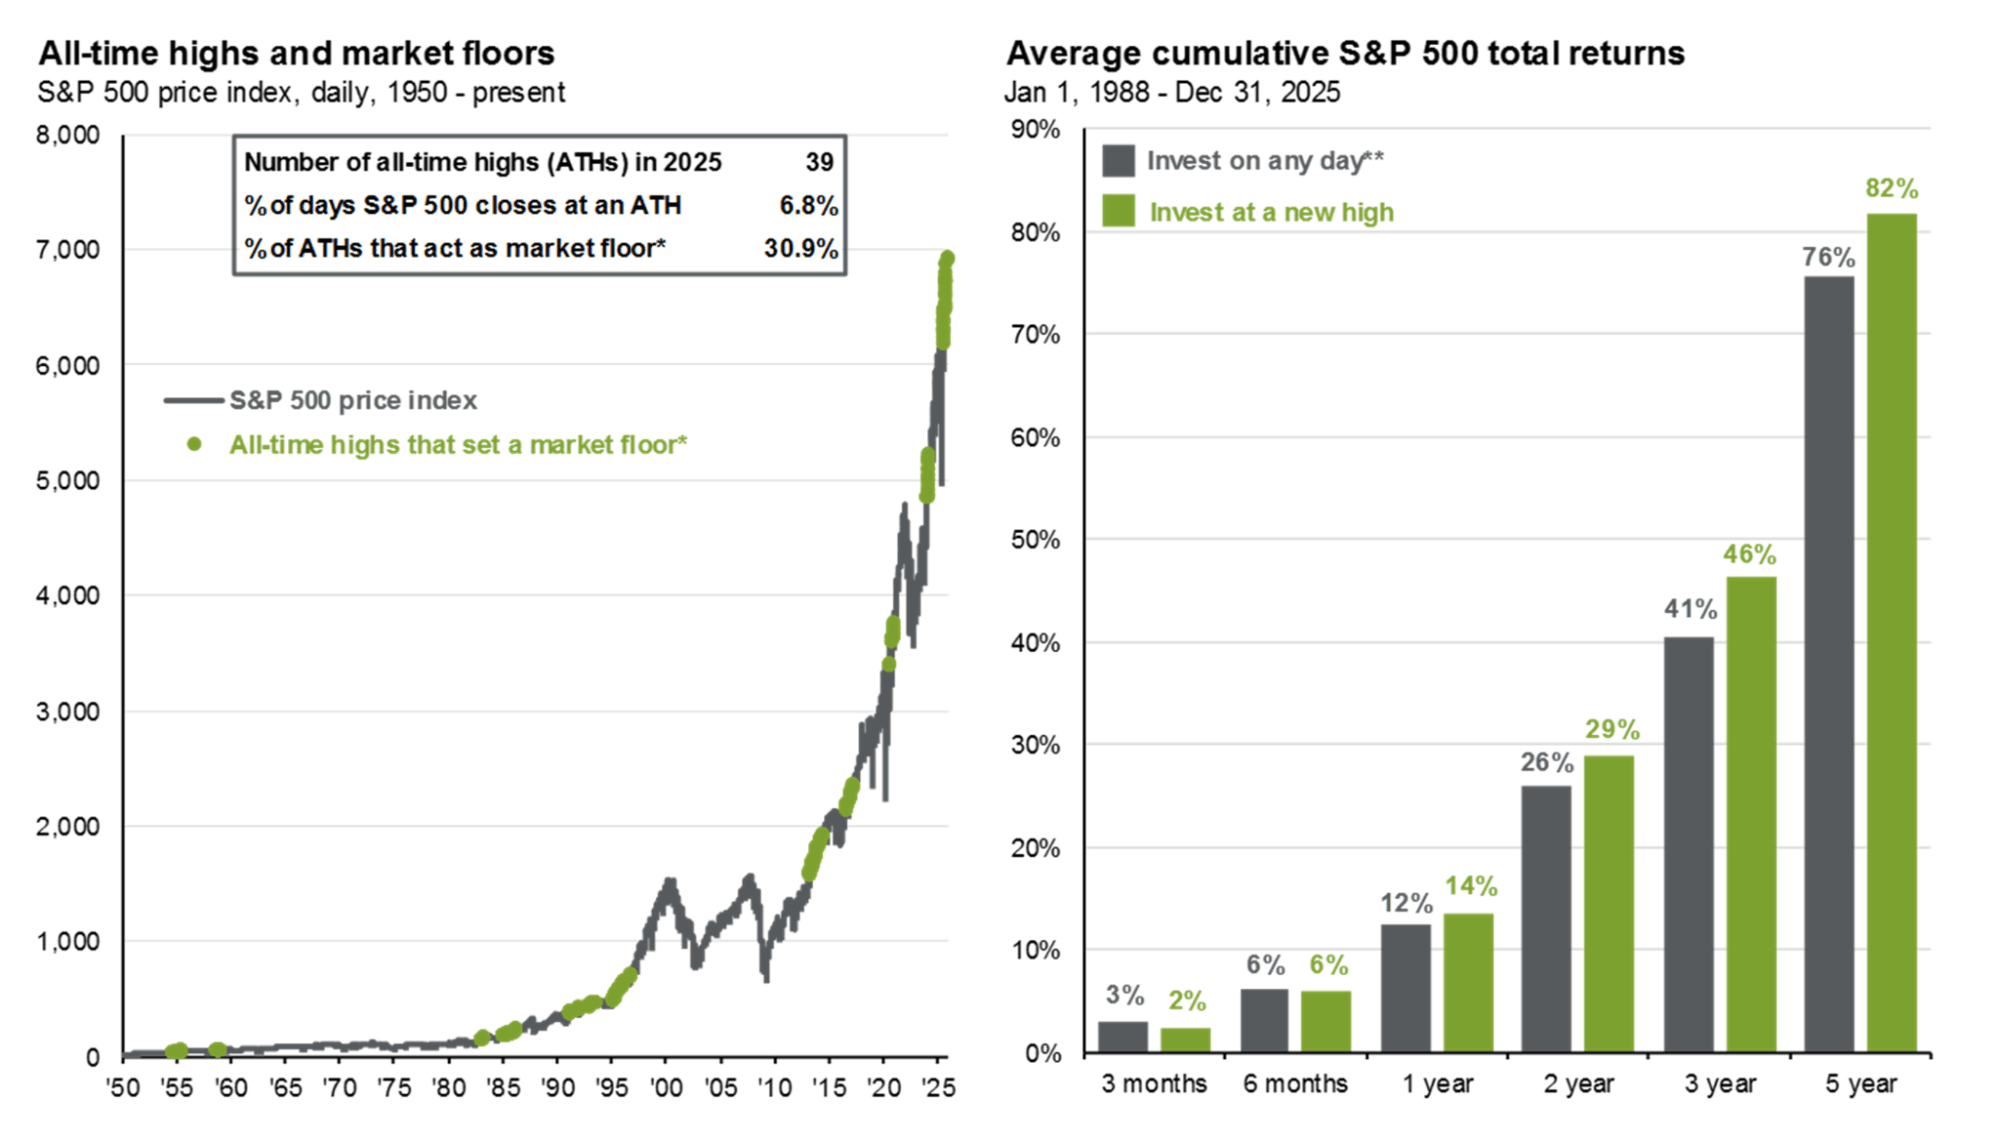
Source: JP Morgan Asset Management
If you're wondering how this is mathematically possible, it's because only buying at all-time highs systematically avoids many of the market's worst-performing days.
7. Where stock market performance comes from
While changes in multiples determine the bulk of short-term performance (46% after 1 year), sales and earnings growth are the primary drivers of long-term returns (89% after 10 years):
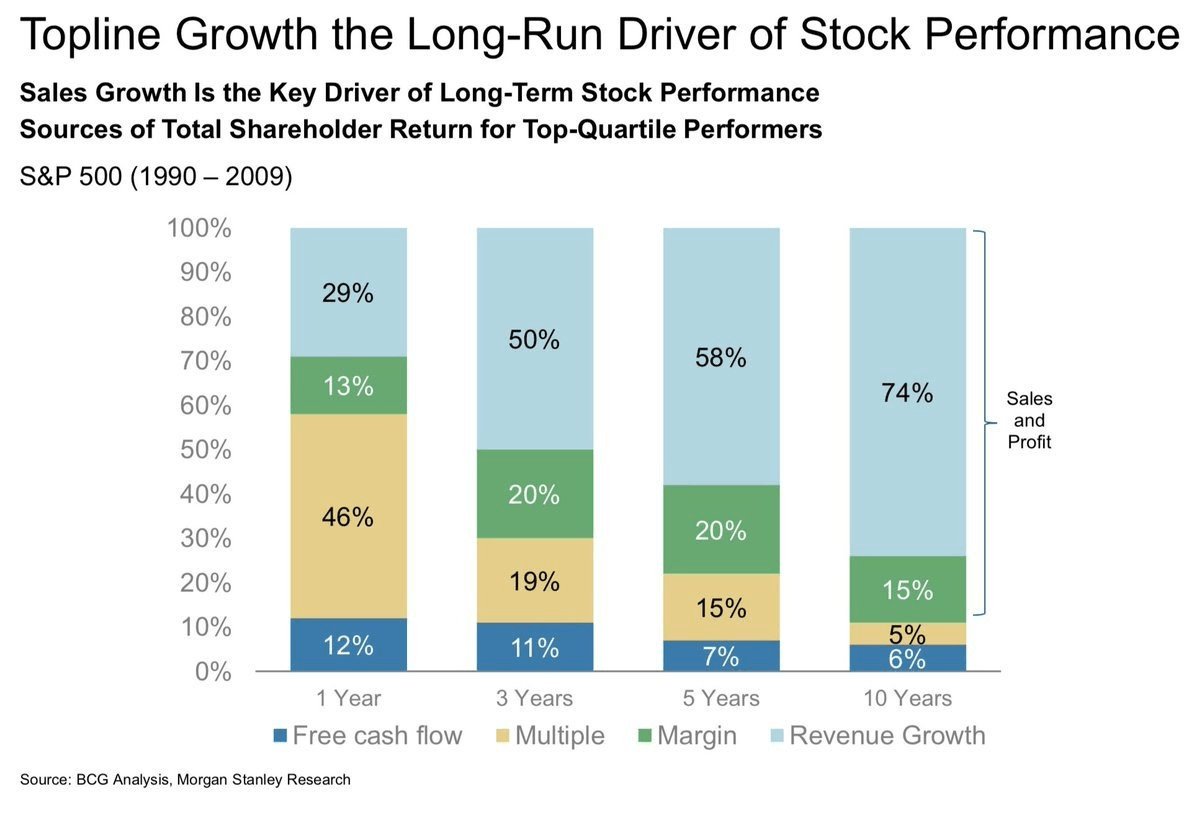
Source: Quality Stocks
Sustainable business expansion is the key to long-term value creation.
Here's another way to look at it:
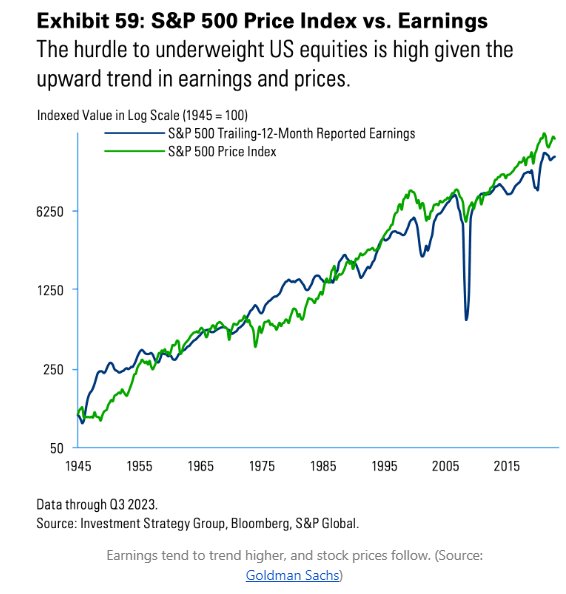
Source: TKer
There have been times when stock prices get ahead of earnings growth, but over the long term, prices have gone up because earnings have gone up.
"In the short run, the market is a voting machine, but in the long run, it is a weighing machine.” — Benjamin Graham.
8. Time stacks the deck in your favor
There are no guarantees in the stock market, but historical data shows that the probability of a positive outcome increases dramatically with time.
Since 1950, the odds of making money in the S&P 500 are close to 50/50 over one-day periods, 74% in one-year periods, 93% in 10-year periods, and 100% in 20-year periods:
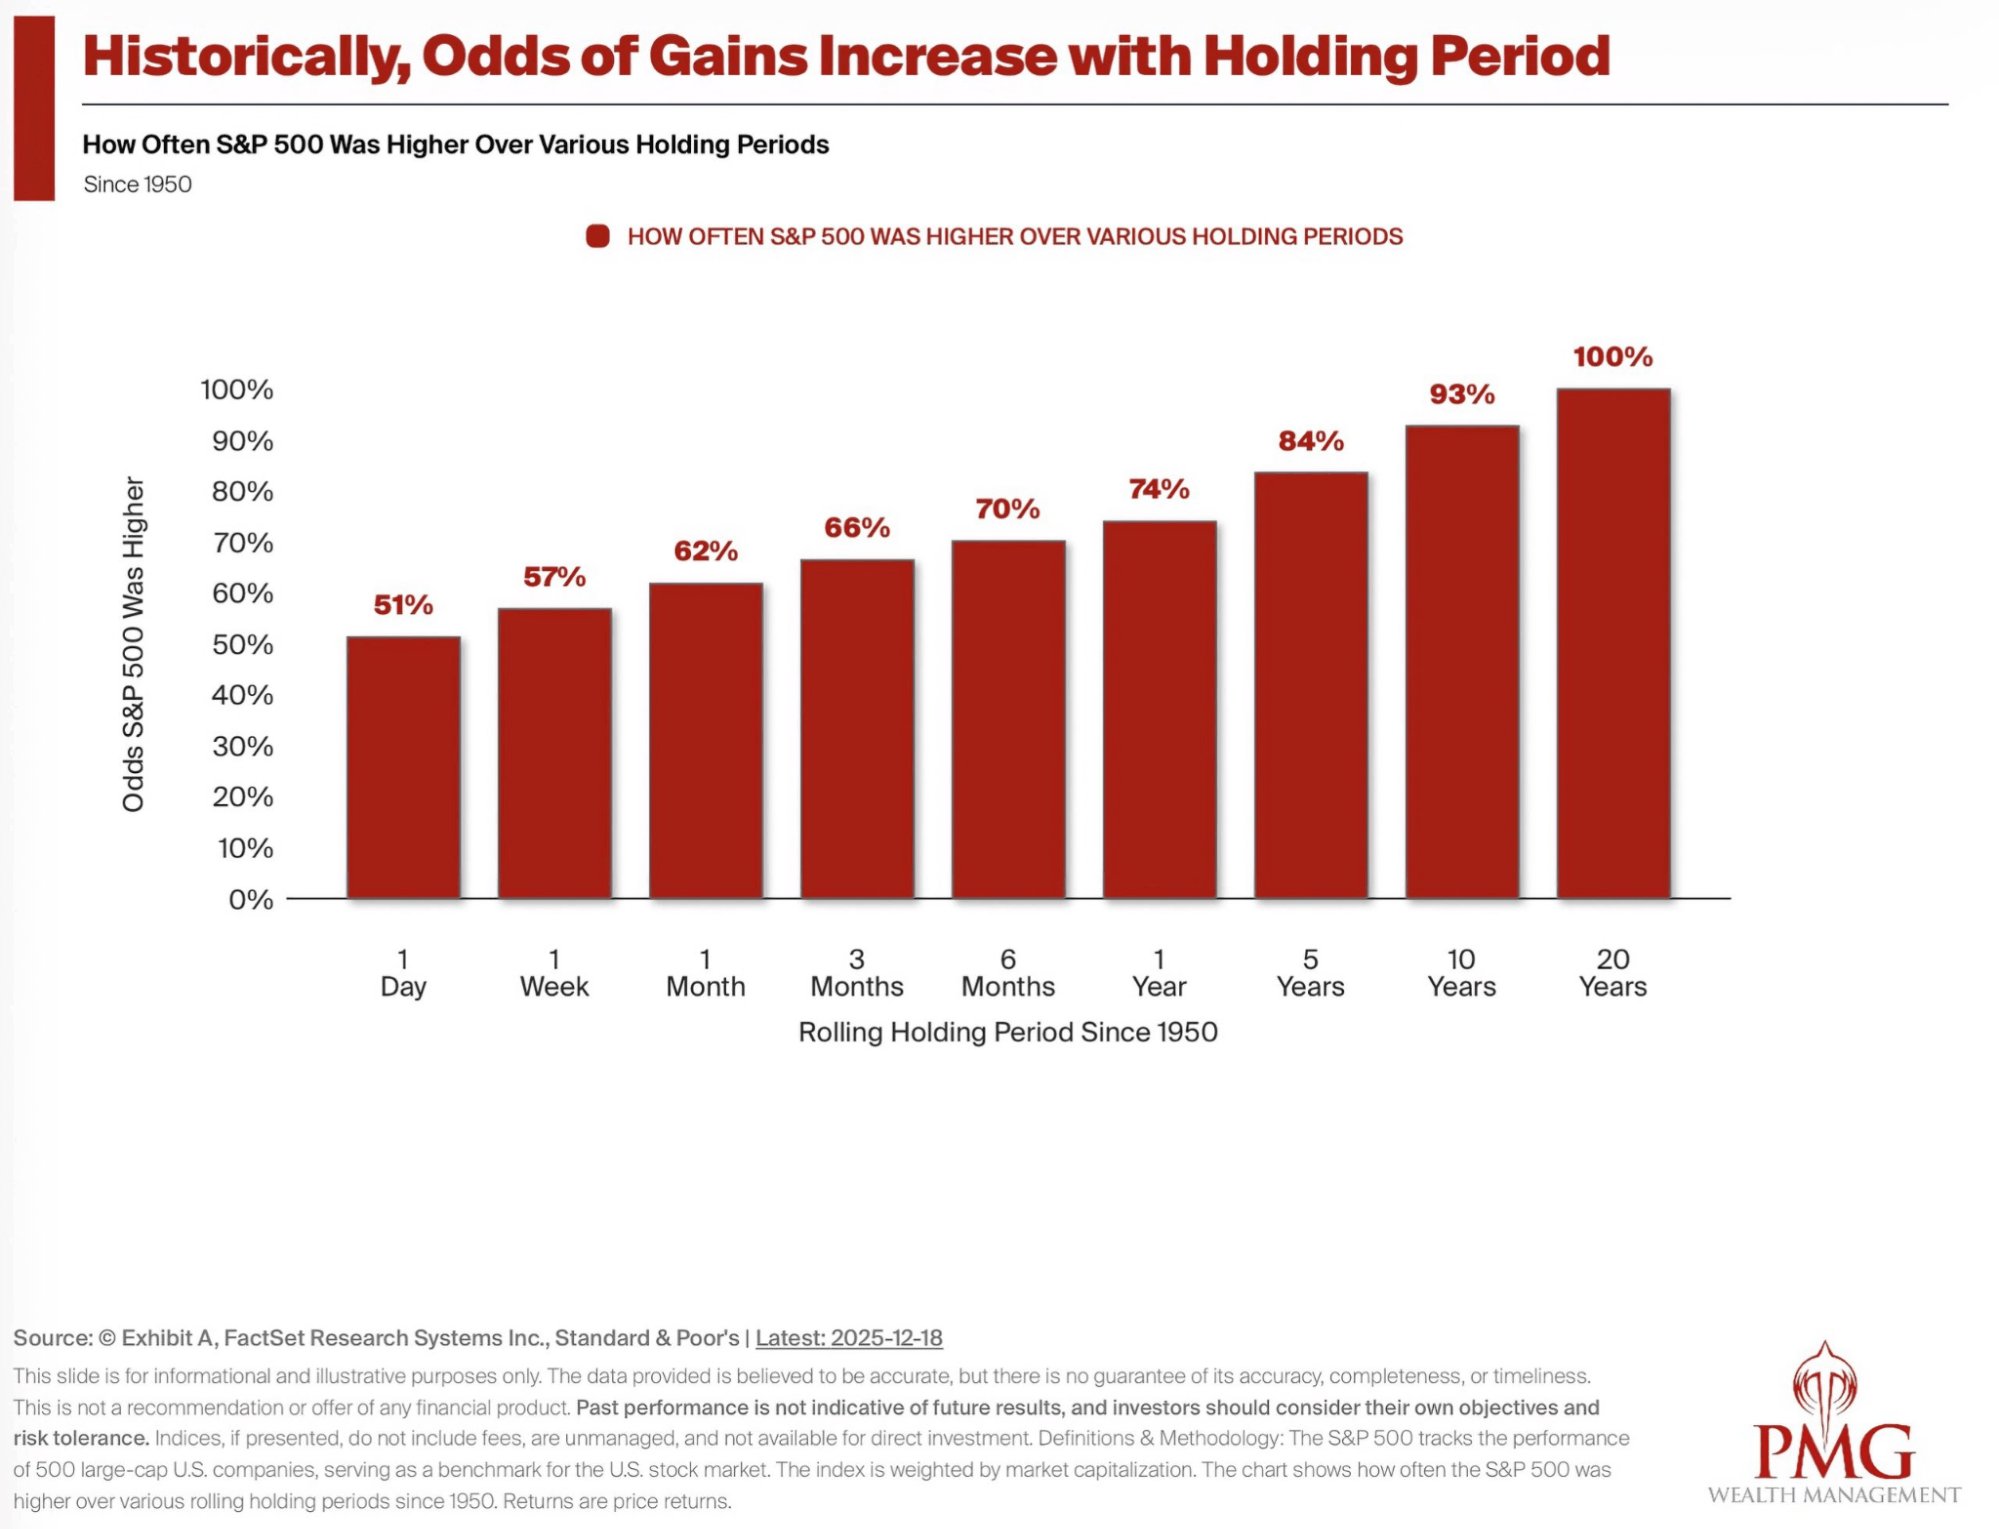
Source: PMG Wealth Management
This is because holding periods of 10–20 years dilute the effect of any single recession or market crash.
In other words, time allows the market's long-term, upward trend to overcome short-term volatility.
Here's another chart that shows that lengthening your time horizon also decreases the range of potential outcomes:
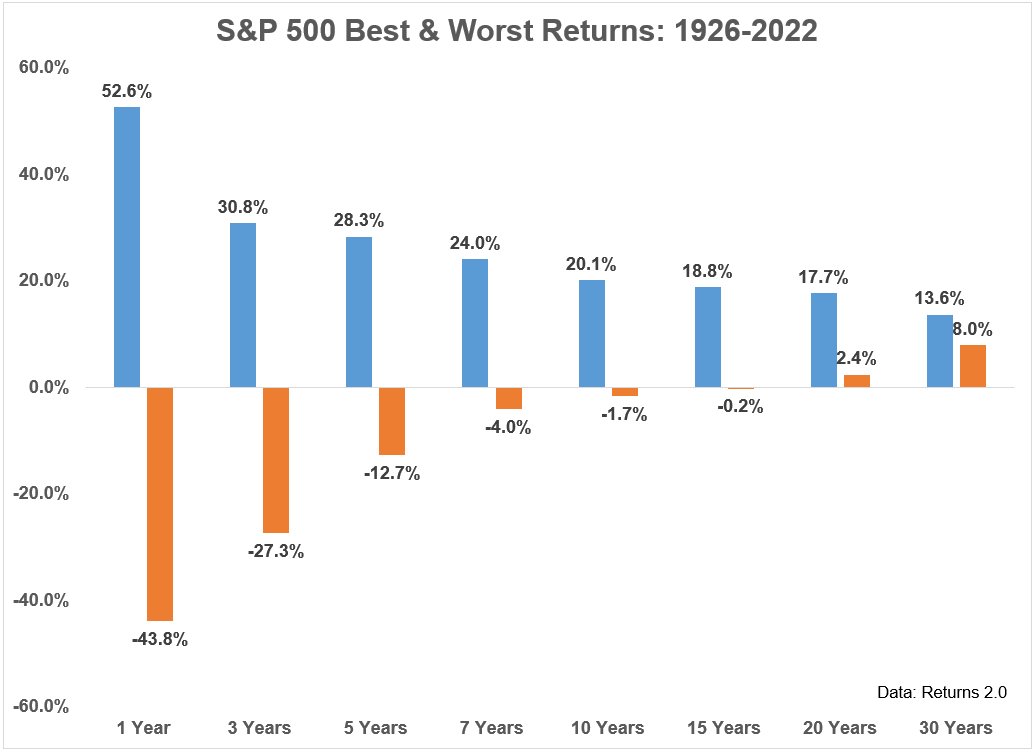
Source: A Wealth of Common Sense
The easiest way to increase your odds of investing success is to increase your holding period.
9. The cost of not investing
While the rest of this article has focused on what you can expect when you invest in stocks, there's also an important point to be made about what to expect if you don't.
The risks of investing are obvious: volatility, drawdowns, uncertainty, and the emotional stress that comes with watching prices move around. Money amplifies these feelings, which is why market downturns feel so uncomfortable.
Because of that, choosing not to invest can feel like the safer option. But it comes with a real, if less visible, cost:
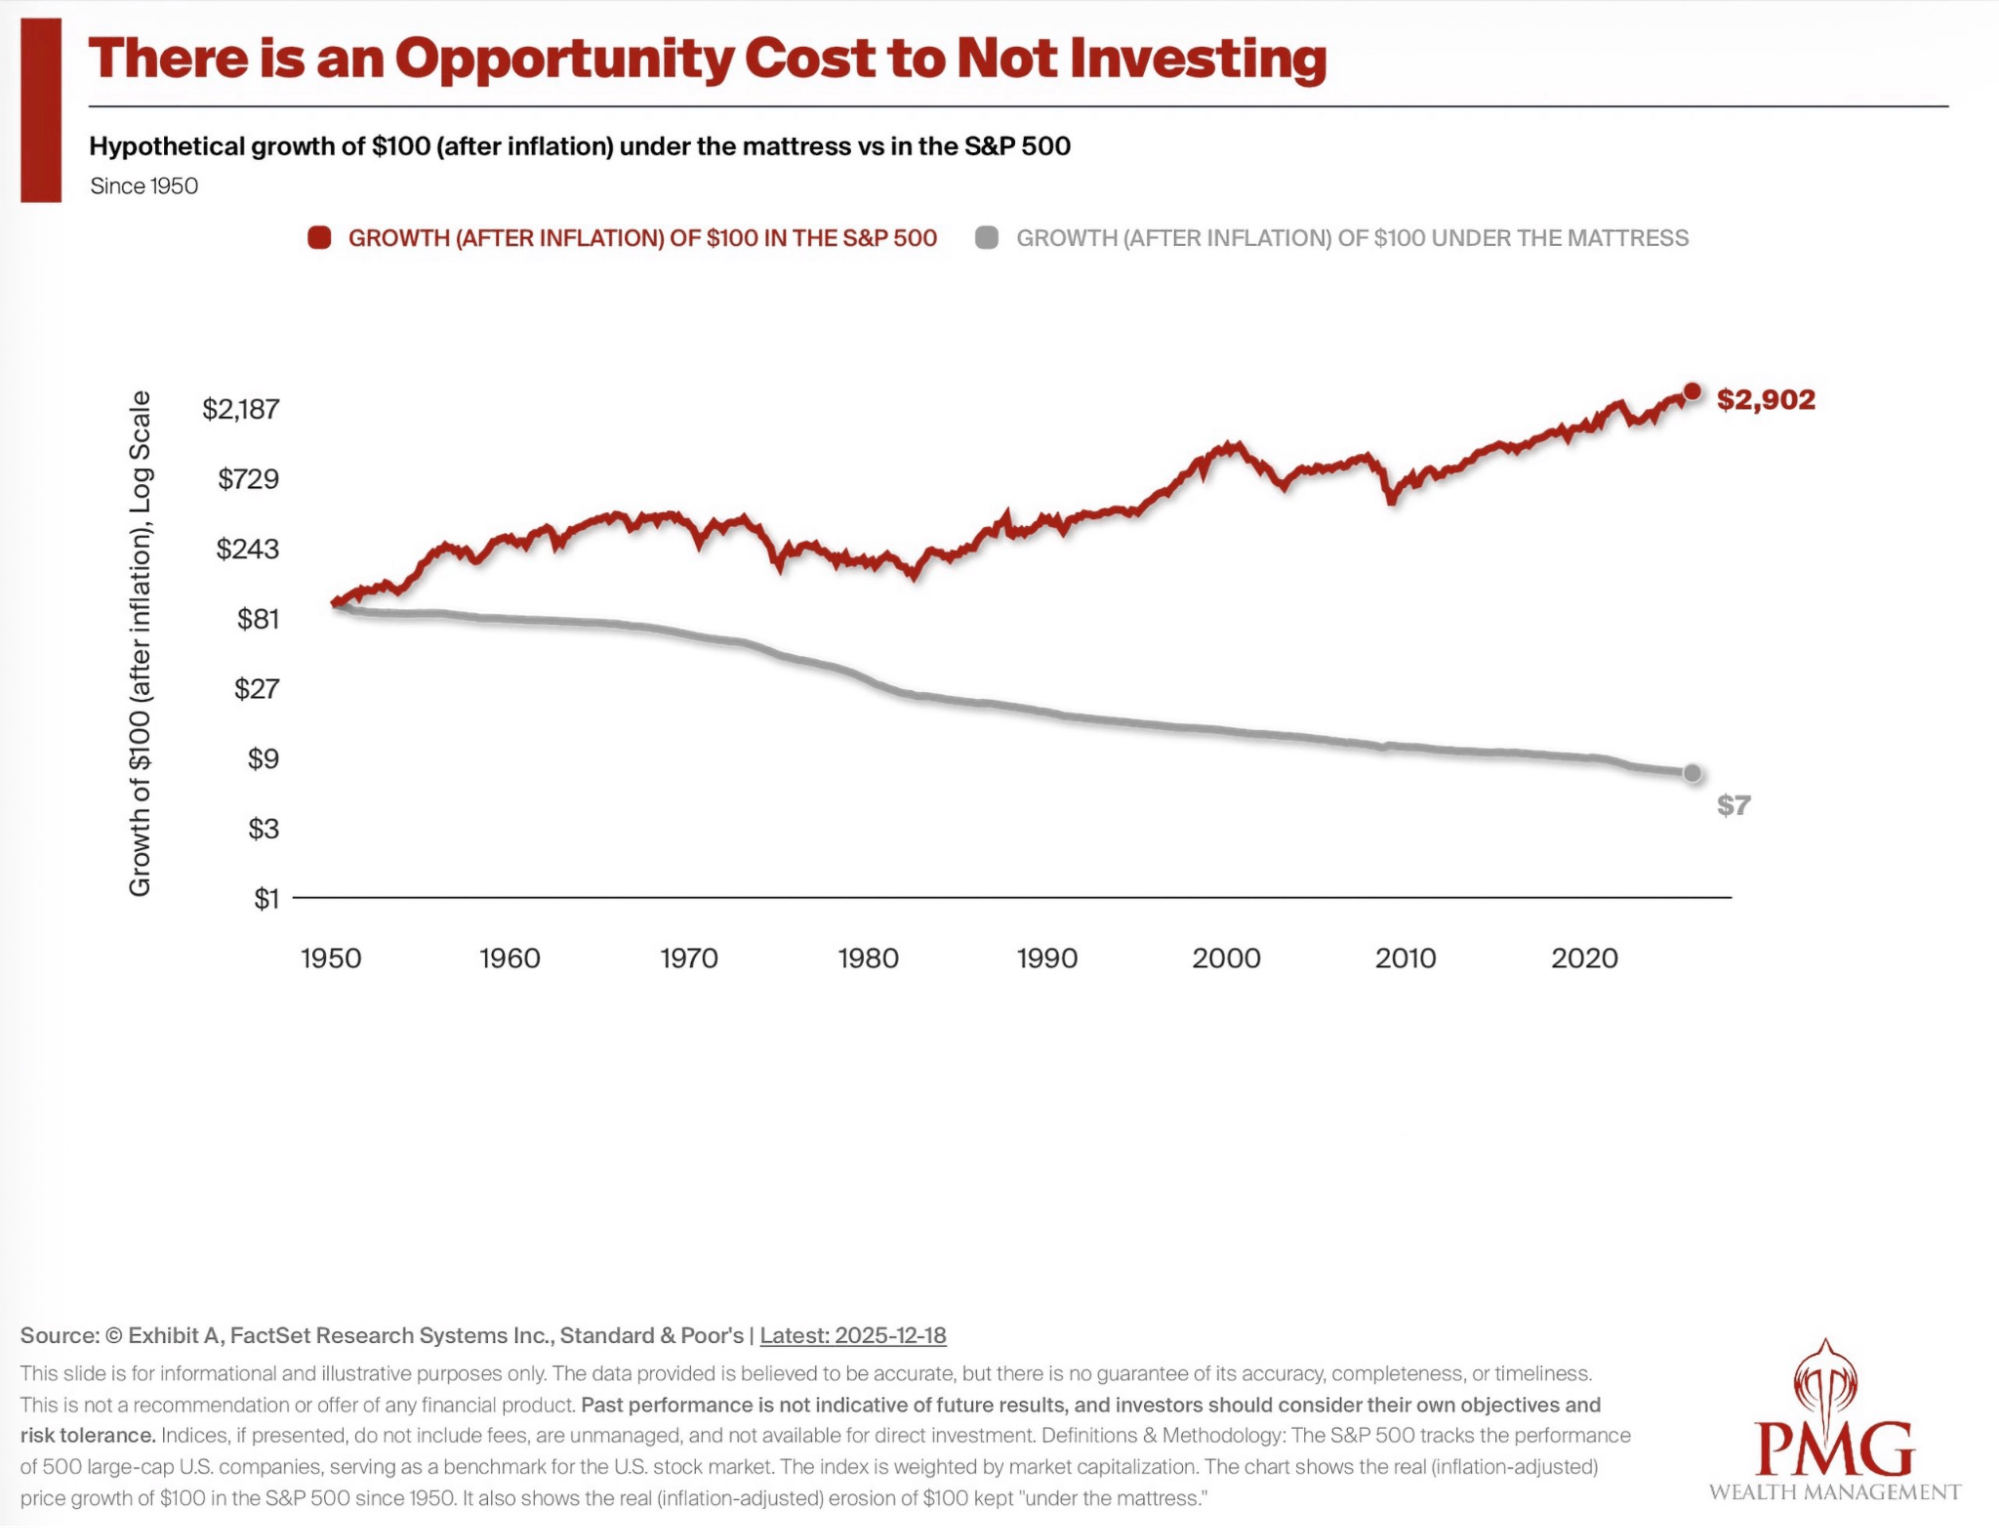
Source: PMG Wealth Management
Holding your savings in cash may feel stable because balances don't fluctuate day to day.
However, inflation steadily erodes purchasing power. Over time, that erosion compounds, and the longer your capital sits on the sidelines, the harder it becomes to catch up.
You can't eliminate risk by investing. But you can't eliminate risk by not investing either. You're simply choosing between visible volatility and invisible decay.
Historically, over long periods, the risk of not investing has been far greater than the risk of staying invested.
Final word
These charts don't remove uncertainty, but they do help set the right expectations.
And when investing, expectations often determine whether you stay the course or abandon it.
Time is the critical ingredient. The longer you stay invested, the more likely you are to experience drawdowns, but the less those drawdowns ultimately matter.