Market Tops: Should You Avoid Investing at All-Time Highs?

With the market at all-time highs, it may seem like now is a bad time to invest.
Although waiting for a pullback may feel like the sensible choice, it's not.
Instead of lowering your risk, avoiding the market at all-time highs often results in missing out on years of compounding returns.
In fact, somewhat counterintuitively, investing at record highs has historically generated higher returns than investing on an average day.
Here's everything you need to know about market tops, and why you shouldn't fear investing at all-time highs.
The data and concepts in this article pertain to investing in the S&P 500 index, not individual stocks.
All-time highs are common
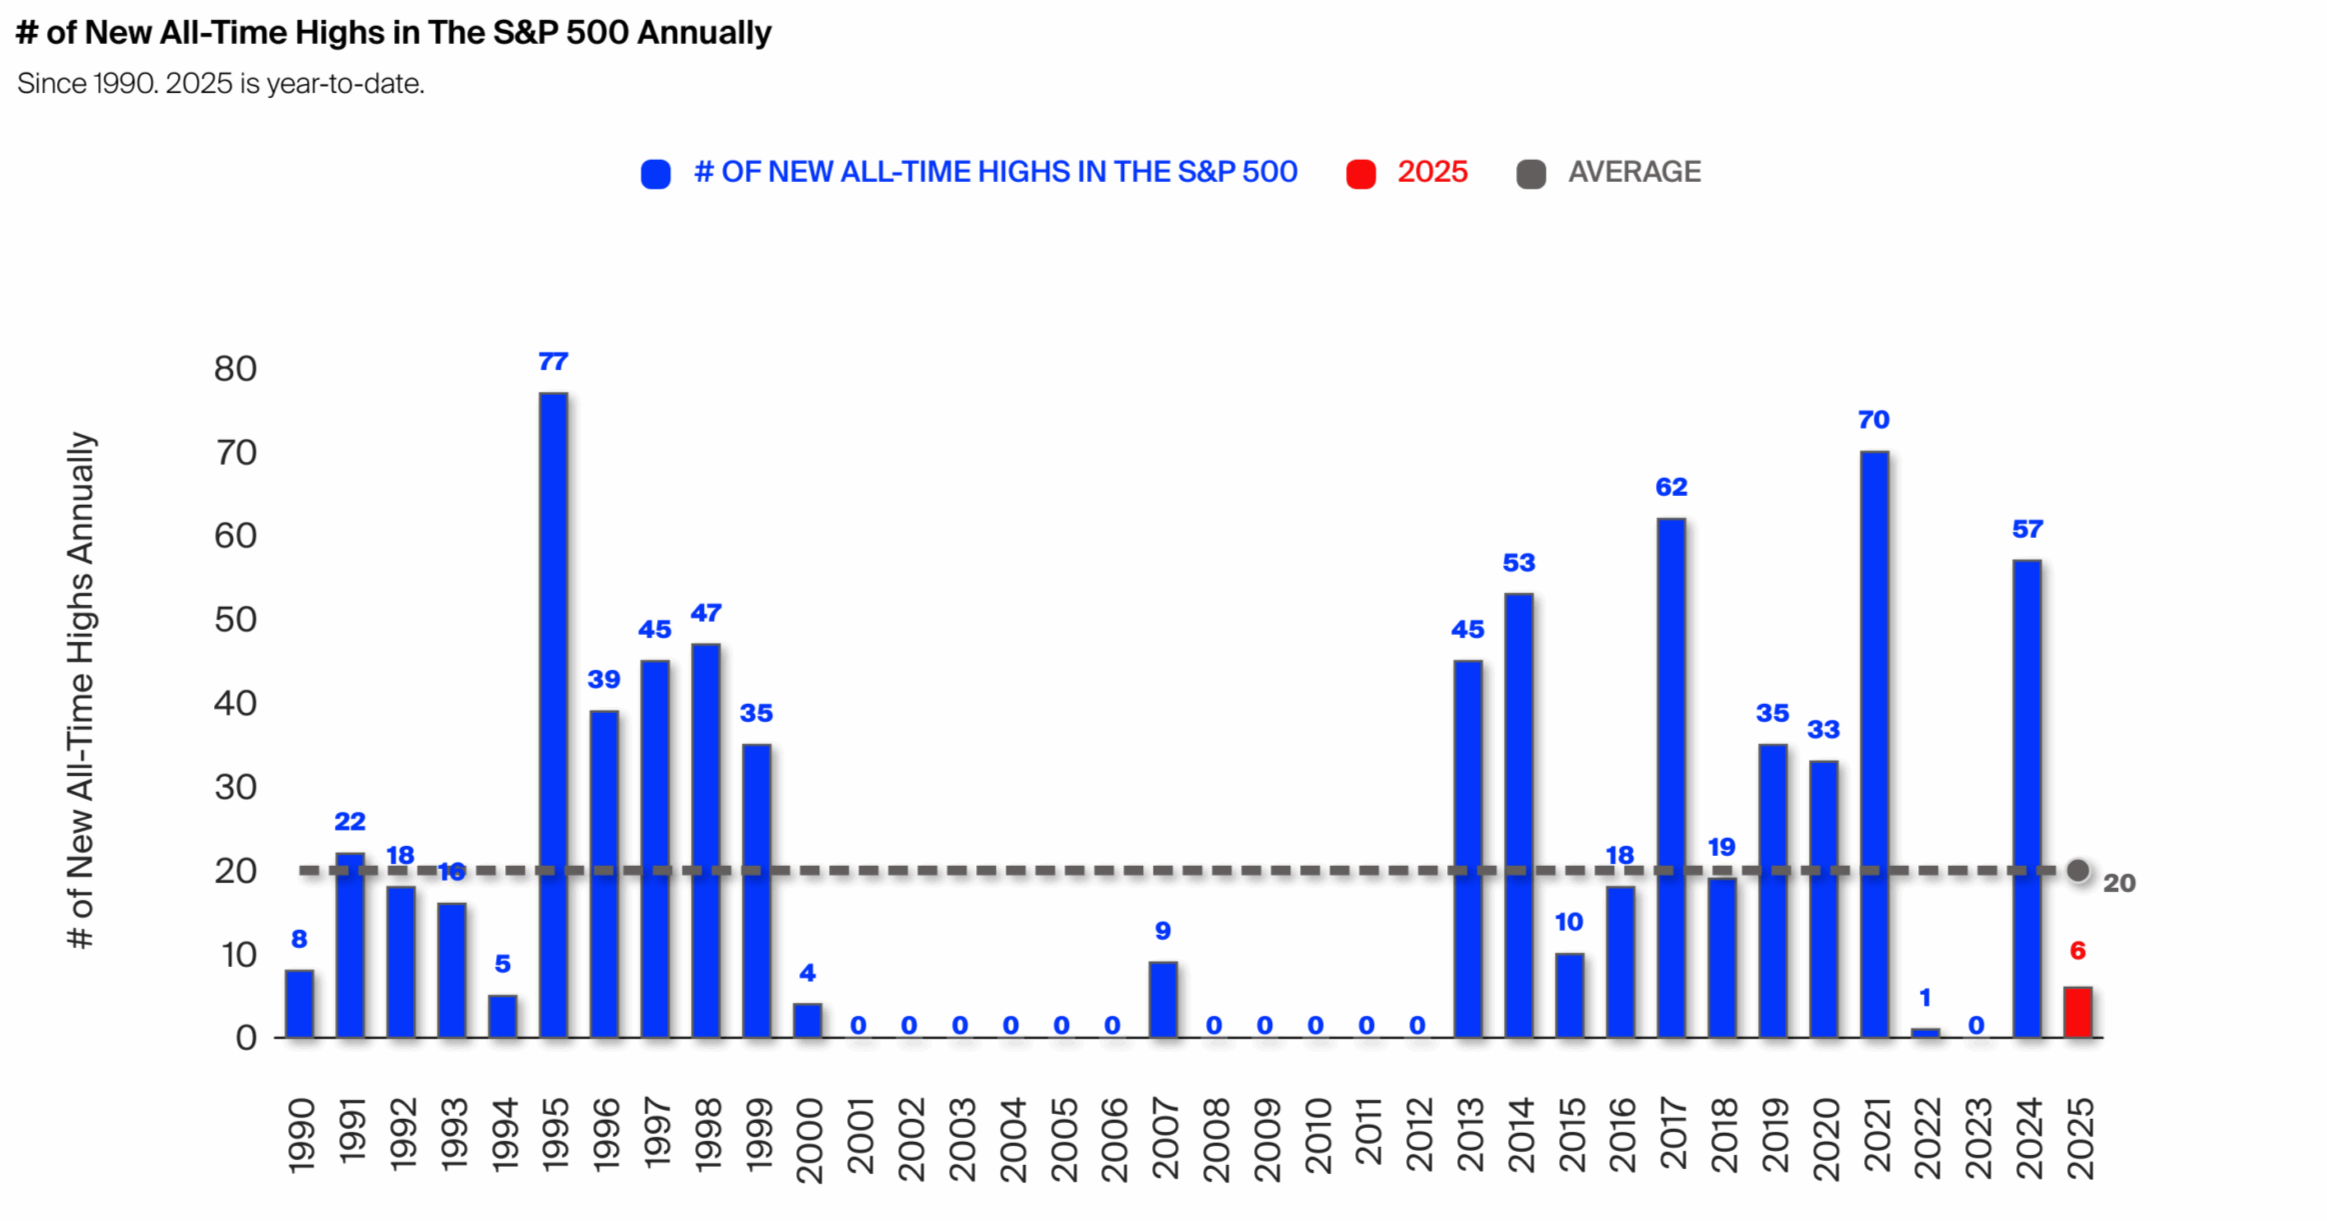
Since 1990, the S&P 500 has set 693 all-time highs:
Source: Exhibit A
That's an average of about 20 new highs per year. That means, over the last 35 years, a new high was set on almost 8% of trading days.
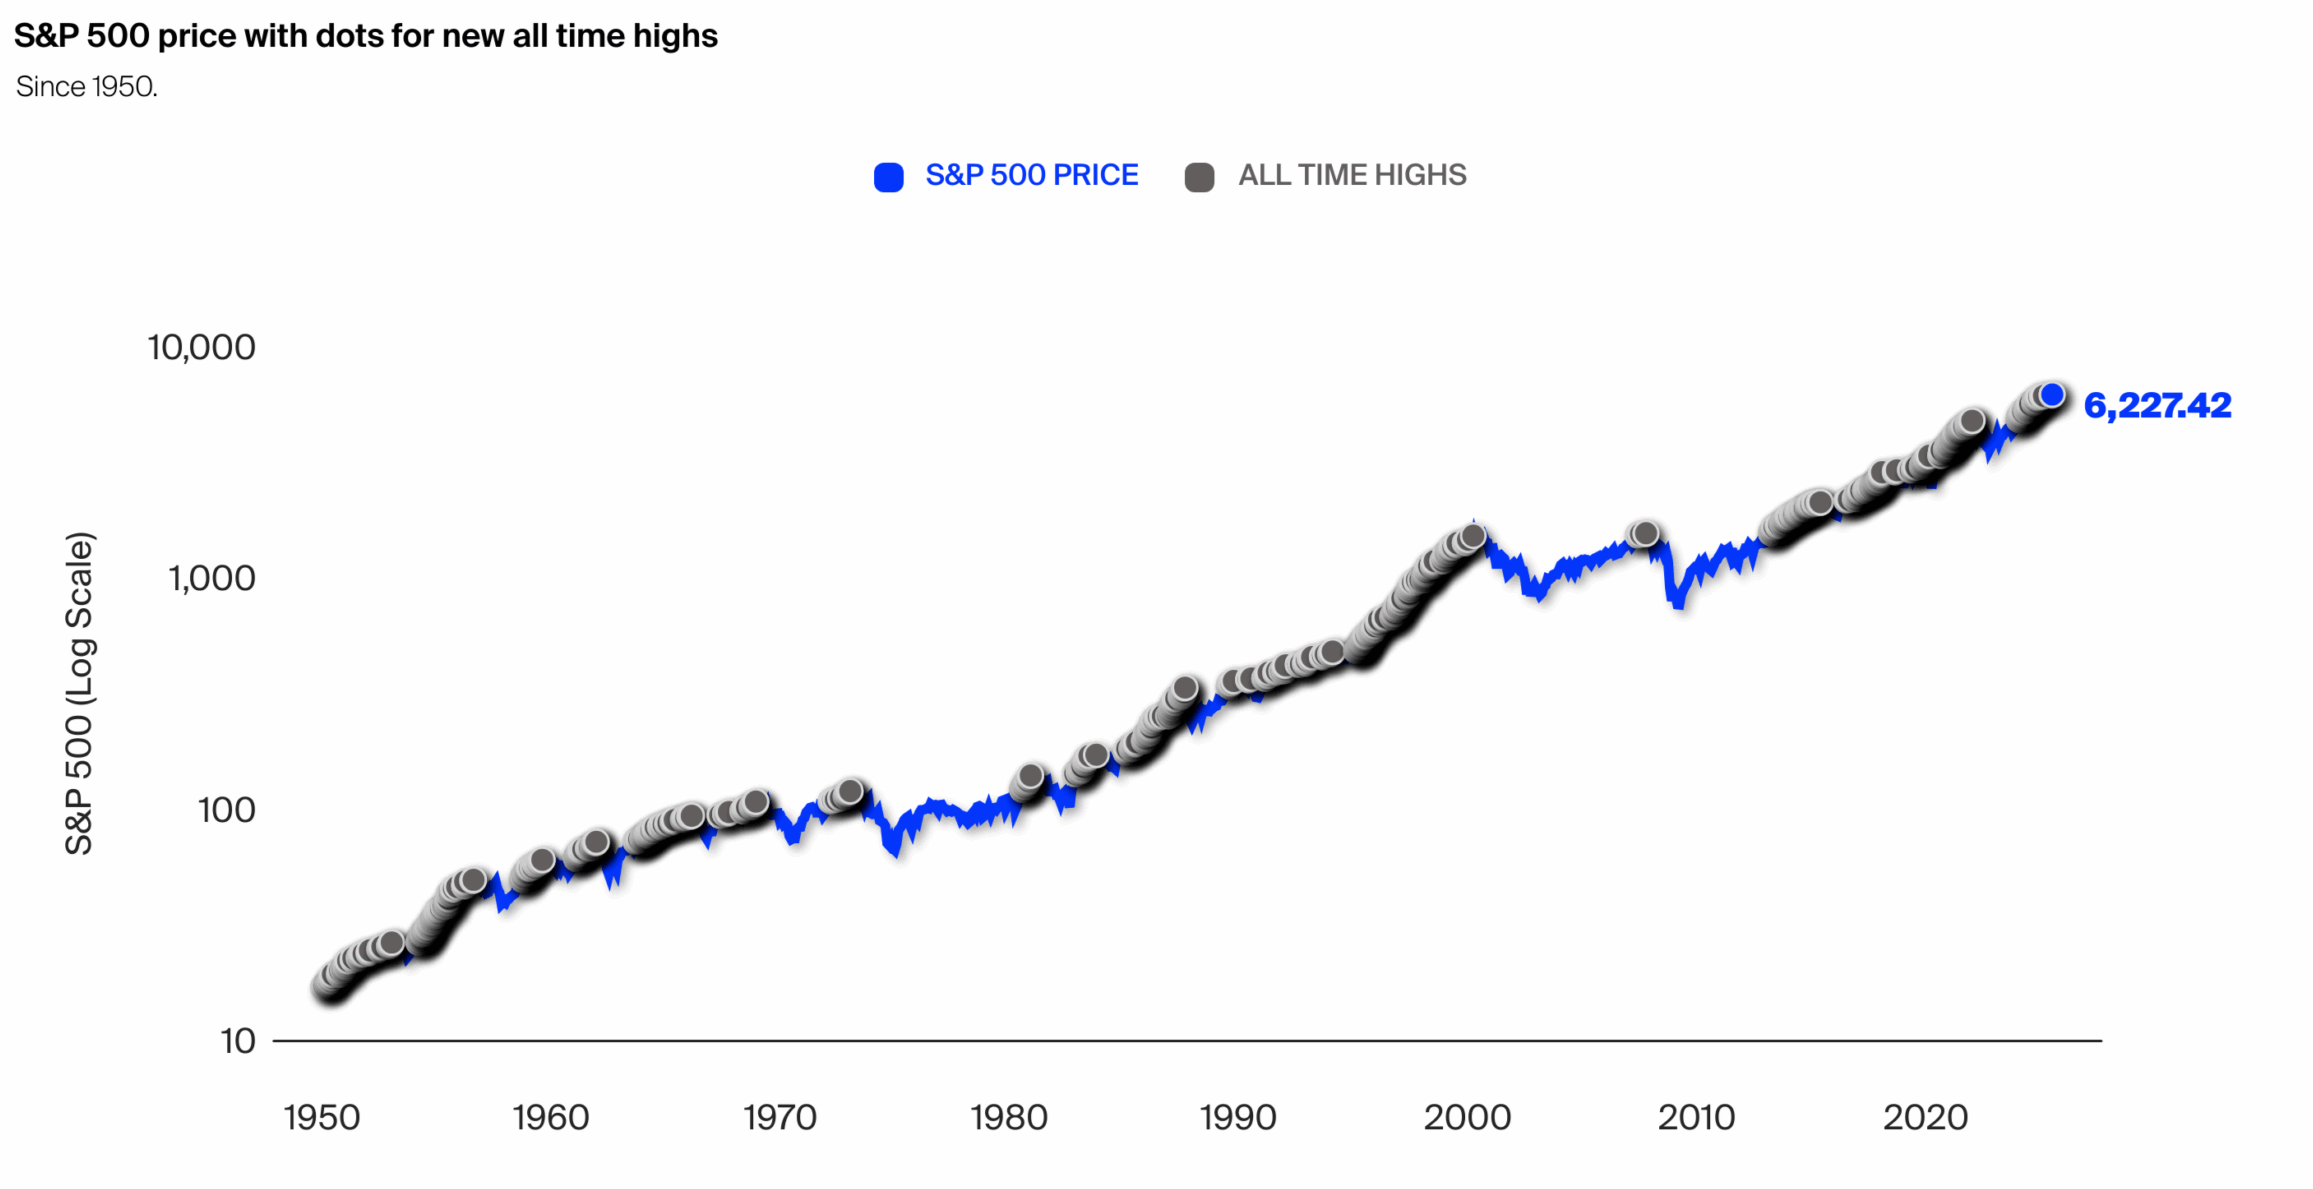
Here's what all of those new highs look like on a chart:
Source: Exhibit A
Notice the clustering — new highs tend to occur consecutively and persistently. In other words, all-time highs tend to be followed by more all-time highs (this is what bull markets are).
Given that companies are growing and becoming more profitable over time, this is exactly what we should expect from a healthy market. You should expect to see many new highs throughout your lifetime.
But just because new highs are common doesn't necessarily mean we should be investing at them.
How does investing at market tops affect returns? In other words, is it a bad time to invest when markets are making new highs?
What are the returns when investing at all-time highs?
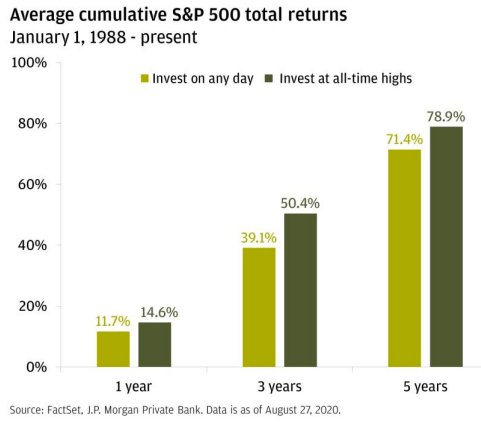
Somewhat counterintuitively, average returns are better when investing at all-time highs.
Check out this chart from JP Morgan:
Source: JP Morgan
If you had invested in the S&P 500 on any given day between January 1988 and August 2020, your average total return a year later would have been +11.7%.
But, if you had only invested on the days when the S&P 500 closed at an all-time high, then your average total return after one year would have been +14.6%.
This trend holds true for 3-year returns (+39.1% vs +50.4%) and 5-year returns (+71.4% vs +78.9%).
If you're wondering how this is mathematically possible, it's because investing only on days that close at all-time highs 1) skips many of the worst-performing periods and 2) puts your money to work immediately in an upward-trending market.
Furthermore, market corrections following new highs are extremely rare.
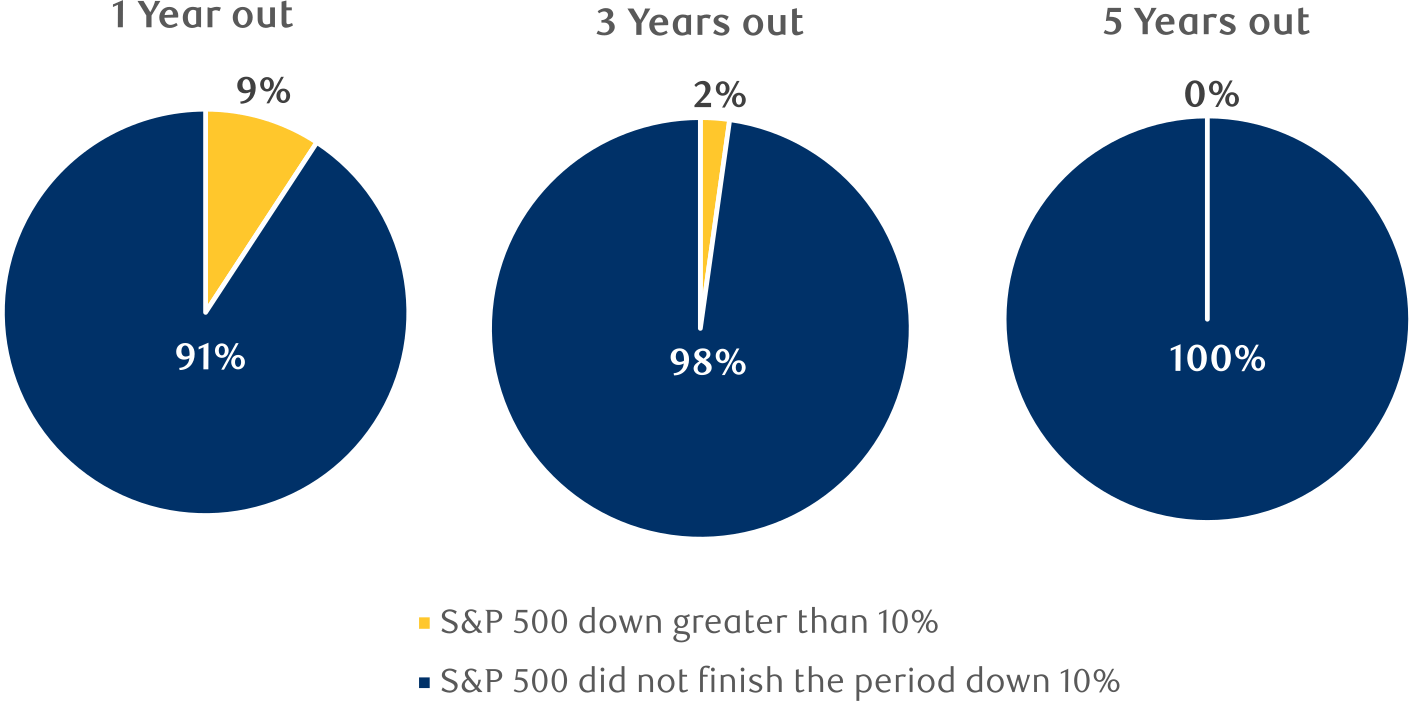
The charts below show how frequently the S&P 500 Index has been down 10% or more over various time periods following each of the 1,250+ all-time highs since 1950:
Source: RBC
Conclusions
- 1 year after reaching an all-time high, the S&P has been down 10% or more only 9% of the time.
- 3 years after reaching an all-time high, the S&P has been down 10% or more only 2% of the time.
- 5 years after reaching an all-time high, the S&P has never been down 10% or more.
Even knowing all of this data, you may still be nervous about investing at a market top.
Here's why.
Why investing at all-time highs is so difficult
If you're looking at this from a purely mathematical perspective, you should be excited to invest at market tops.
But we don't live our lives in spreadsheets, and the psychological hurdle of investing at an all-time high can be difficult to overcome.
And that's because one of these all-time highs will be the last market peak before a bear market. Buying at an all-time high exposes us to the possibility of the worst possible returns, usually for years, until the bear market ends.
So even though the math tells you the stock market is positive two out of every three years and investing at all-time highs generates above-average returns, the fear of investing at the very top keeps people stuck on the sidelines.
No one wants to buy at the very peak.
Yes, if you buy at all-time highs, you run the risk of buying at the last new high before a bear market. There's no getting around that.
But it turns out that's not really anything to fear, either.
Why you don't need to worry about timing the market
The question you're asking — “Should I invest when markets are at all-time highs?” (which is really a question about market timing) — is largely irrelevant.
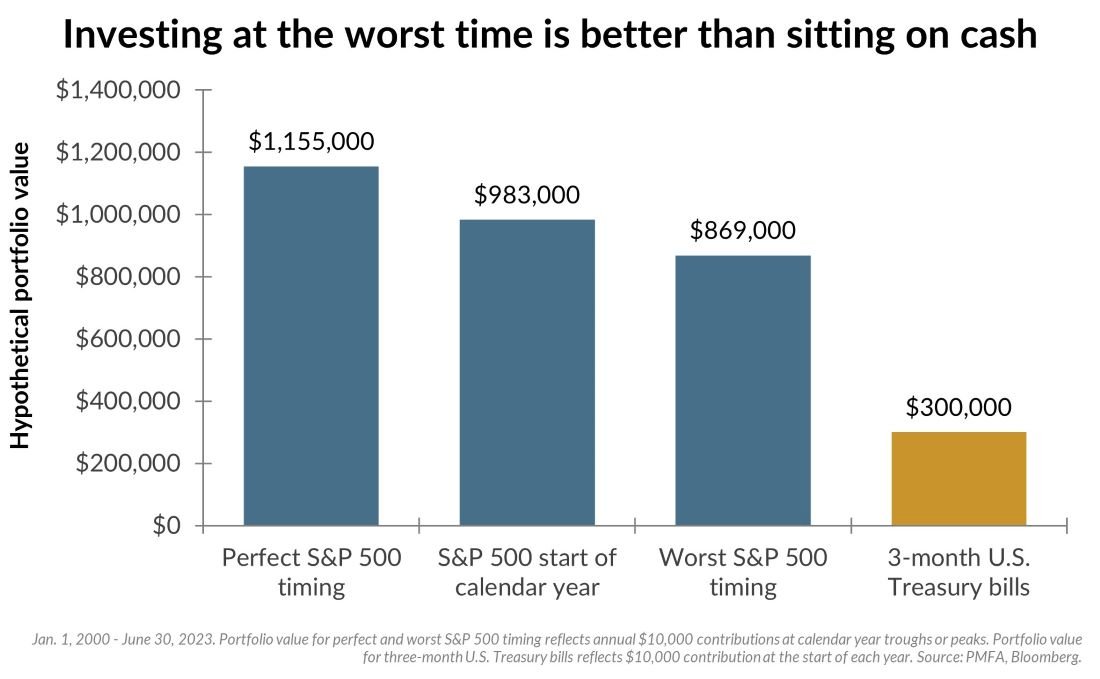
Historically speaking, the difference between investing on the worst possible days (the highest point of each year) vs the best possible days (the lowest point of each year) isn't as significant as you might think.
Here's a chart that shows the difference in returns between perfect timing and the worst timing for the S&P between January 2000 and June 2023:
Source: Plante & Moran
Although achieving the impossible task of investing at the best possible time each year does result in higher returns, the difference is surprisingly small.
And even if you had the incredibly unfortunate luck to invest on the worst possible day every year for 23 consecutive years, your portfolio would not be lagging by that much, and you still would have outperformed 3-month Treasuries by nearly 3x.
The lesson is clear: as long as you stay invested, the exact timing should be an afterthought. It's hard to lose when your strategy is simply being in the market.
How do dividends affect stock returns?
The final word
Hopefully, this article has made you more comfortable with the idea of investing when the stock market is at or near all-time highs.
As long-term investors, we should be accustomed to buying and holding at market highs. The data clearly shows all-time highs are common and are frequently followed by periods of strong performance and more record highs.
Yes, a handful of them will precede market crashes. But most of them will be followed by more highs.
Either way, the data says you'll be fine.
If you're uncomfortable with the idea of investing at all-time highs, try buying in small amounts on a regular basis (dollar-cost averaging) rather than lump-sum investing.
This way, you can slowly increase your exposure without the regret of sitting out while stocks move higher.


