VanEck Oil Services ETF (OIH)
| Assets | $1.76B |
| Expense Ratio | 0.35% |
| PE Ratio | 20.02 |
| Forward PE | 17.44 |
| Shares Out | 4.90M |
| Dividend | $4.87 (1.32%) |
| Ex-Dividend Date | Dec 22, 2025 |
| Payout Frequency | Annual |
| Payout Ratio | 26.74% |
| Volume | 138,903 |
| Open | 368.05 |
| Previous Close | 369.54 |
| Day's Range | 365.30 - 372.31 |
| 52-Week Low | 270.55 |
| 52-Week High | 459.28 |
| Beta | 0.94 |
| Holdings | 26 |
| Inception Date | Feb 7, 2001 |
About OIH
Fund Home PageThe VanEck Oil Services ETF (OIH) is an exchange-traded fund that is based on the MVIS US Listed Oil Services 25 index, a market-cap-weighted index of 25 of the largest US-listed, publicly traded oil services companies. OIH was launched on Feb 7, 2001 and is issued by VanEck.
Top 10 Holdings
73.53% of assets| Name | Symbol | Weight |
|---|---|---|
| SLB N.V. | SLB | 20.87% |
| Baker Hughes Company | BKR | 10.67% |
| Halliburton Company | HAL | 6.61% |
| TechnipFMC plc | FTI | 6.60% |
| Tenaris S.A. | TS | 6.26% |
| Transocean Ltd. | RIG | 4.89% |
| Weatherford International plc | WFRD | 4.88% |
| Solaris Energy Infrastructure, Inc. | SEI | 4.54% |
| Noble Corporation plc | NE | 4.14% |
| NOV Inc. | NOV | 4.07% |
Dividend History
| Ex-Dividend | Amount | Pay Date |
|---|---|---|
| Dec 22, 2025 | $4.869 | Dec 26, 2025 |
| Dec 23, 2024 | $5.4394 | Dec 24, 2024 |
| Dec 18, 2023 | $4.2235 | Dec 22, 2023 |
| Dec 19, 2022 | $2.8887 | Dec 23, 2022 |
| Dec 20, 2021 | $1.8075 | Dec 27, 2021 |
| Dec 21, 2020 | $1.8911 | Dec 28, 2020 |
Performance
OIH had a total return of 27.53% in the past year, including dividends. Since the fund's inception, the average annual return has been -3.14%.
News

Global Oil Market Set to Return to Surplus as Gulf Exports Recover, IEA Says
The global oil market is expected to return to a surplus in the final quarter of this year for the first time since the outbreak of the Iran war, the International Energy Agency said Friday.


Oil prices set for second weekly decline as Trump to stay with Iran blockade
Oil prices were mixed on Friday, but set for their second weekly decline, as the US plans to continue its Iranian blockade, reducing the chance of renewed large-scale fighting that could disrupt Midd...


WTI Price Forecast: Bearish Breakdown Raises Downside Risk
WTI crude oil remains under bearish pressure after breaking below its 200-day moving average, with a double top increasing downside risk toward key Fibonacci and trendline support.


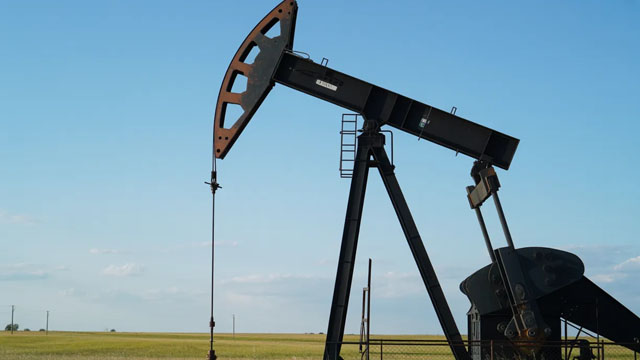
U.S. Crude-Oil Stockpiles Post Unexpected Weekly Build
Commercial crude-oil inventories rose by 4.7 million barrels to 414.4 million barrels, the EIA said. Inventories were expected to have fallen by 700,000 barrels, according to a Wall Street Journal sur...




Oil prices drop more than $1 as hopes for Iran, Ukraine peace talks pressure markets
Oil prices moved slightly lower on Thursday after recovering from earlier losses, as persistent geopolitical tensions in the Middle East and Russia offset pressure from rising crude output.


Oil Rebounds as Tight Inventories and Middle East Risks Support Prices
WTI and Brent rebound from key technical support as tight U.S. distillate inventories and Middle East supply risks offset strong crude production and uncertain export demand.


Saudi Arabia leads further jump in OPEC+ oil output despite war
Top oil exporter Saudi Arabia boosted oil output in October to the highest since February, the last month before the Iran war disrupted Middle East supplies, OPEC's monthly report on its website ...


Natural Gas and Oil Forecast: Oil Rebounds From Two-Month Low, Can WTI Hold $83.99?
Natural gas and oil forecast: oil rebounds from a two-month low as Hormuz attacks persist, with WTI below $91.84, Brent testing $93.28 and NG above $3.25.


Oil rises from two-month low as Hormuz shipping attacks offset Iran truce hopes
Oil prices rose about 1% on Wednesday from the previous session's two-month lows, after Iran's security chief said Tehran would not allow even a single particle of enriched nuclear material to leave ...