China CAMC Engineering Co., Ltd. (SHE:002051)
 China · Delayed Price · Currency is CNY
 | Market Cap | 13.28B +26.5% |
| Revenue (ttm) | 11.41B -6.5% |
| Net Income | 307.37M -14.9% |
| EPS | 0.25 -13.8% |
| Shares Out | 1.24B |
| PE Ratio | 42.92 |
| Forward PE | n/a |
| Dividend | 0.13 (1.16%) |
| Ex-Dividend Date | Jul 10, 2025 |
| Volume | 166,513,896 |
| Average Volume | 62,108,789 |
| Open | 9.89 |
| Previous Close | 11.50 |
| Day's Range | 9.89 - 11.62 |
| 52-Week Range | 7.31 - 12.68 |
| Beta | 0.29 |
| RSI | 64.50 |
| Earnings Date | Apr 25, 2026 |
About China CAMC Engineering
China CAMC Engineering Co., Ltd. engages in construction, project management, machine operation, and maintenance business. It is involved in surveying and design, planning consulting, financing and investment, procurement and supply of equipment activities. The company also offers design consultation services and engineering contracting services. In addition, it provides passenger cableways, logistics warehousing, lifting machinery, and environmental protection equipment services. Additionally, it is involved in turnkey projects constructions r... [Read more]
Financial Performance
In 2025, China CAMC Engineering's revenue was 11.41 billion, a decrease of -6.55% compared to the previous year's 12.21 billion. Earnings were 307.37 million, a decrease of -14.93%.
Financial StatementsNews
Nepal charges dozens and says corruption inflated an airport’s costs by $74 million
KATHMANDU, Nepal (AP) — Former Nepali ministers, officials and a Chinese company were charged with corruption over financial irregularities during the construction of an international airport. The Com...
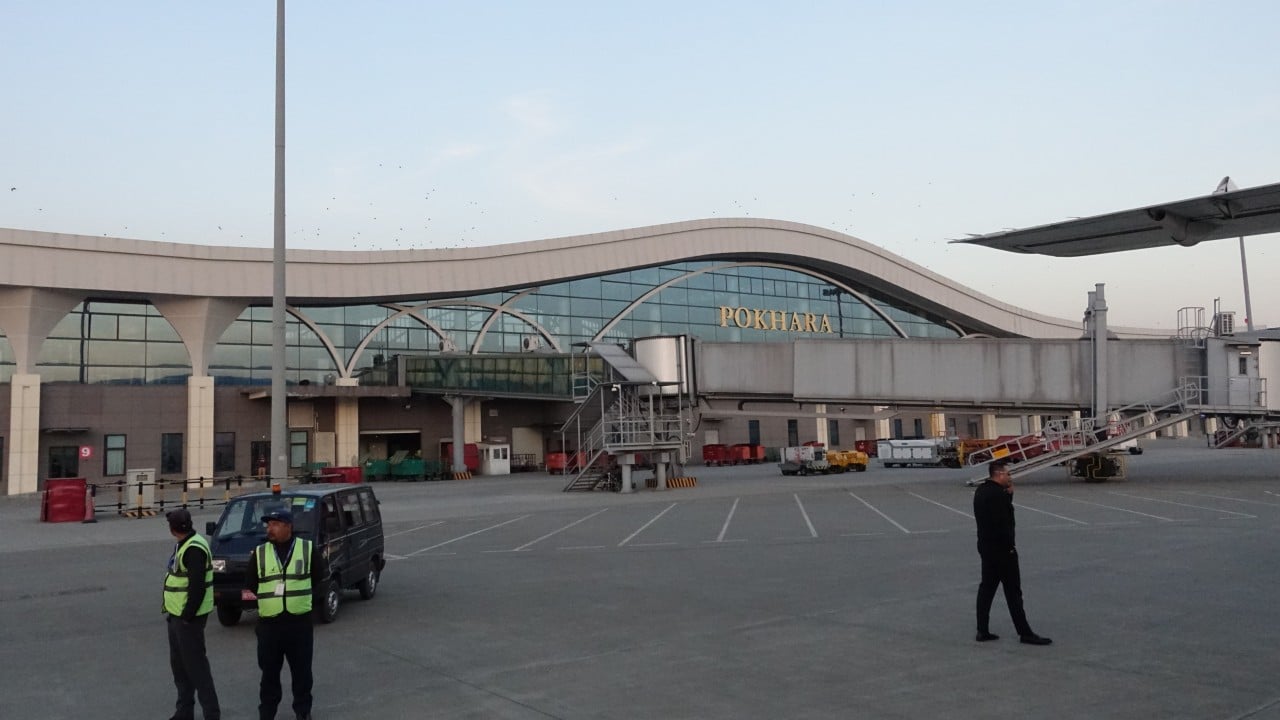
Nepal charges Chinese contractor with corruption over airport deal
Nepal’s anti-corruption watchdog has filed criminal charges against ex-ministers, senior bureaucrats and a Chinese state-owned construction giant accused of inflating costs and manipulating contracts ...