
The 6 Best Websites for Historical Financial Data

Real-time financial data is everywhere, but tracking down historical stock data can be more challenging.
Whether you're building a spreadsheet, backtesting a strategy, or just trying to confirm a company's revenue in 2017, it can be surprisingly difficult to get the exact data you need.
That's why I made this list.
Below, I ranked the six best websites for accessing historical financial data. You can use the summary section below to pinpoint the website most likely to have the data you're looking for, and then read more about the website further down.
Summary of the best sites for historical financial data
| Website | Best for |
| Yahoo Finance, MarketWatch |
|
| Koyfin |
|
| EDGAR |
|
| Investor relations pages |
|
| Morningstar |
|
| Databento, EODHD, Massive, Marketstack |
|
Disclosure: Some of these are affiliate links. We may receive compensation if you take action through them.
1. Yahoo Finance, MarketWatch: best free sites for basic stock information
Yahoo Finance has long been one of the go-to websites for stock quotes, statistics, valuation metrics, financial statements, and more.
And although its interface has become cluttered with ads over the last several years, it's still one of the best places to find free stock data.
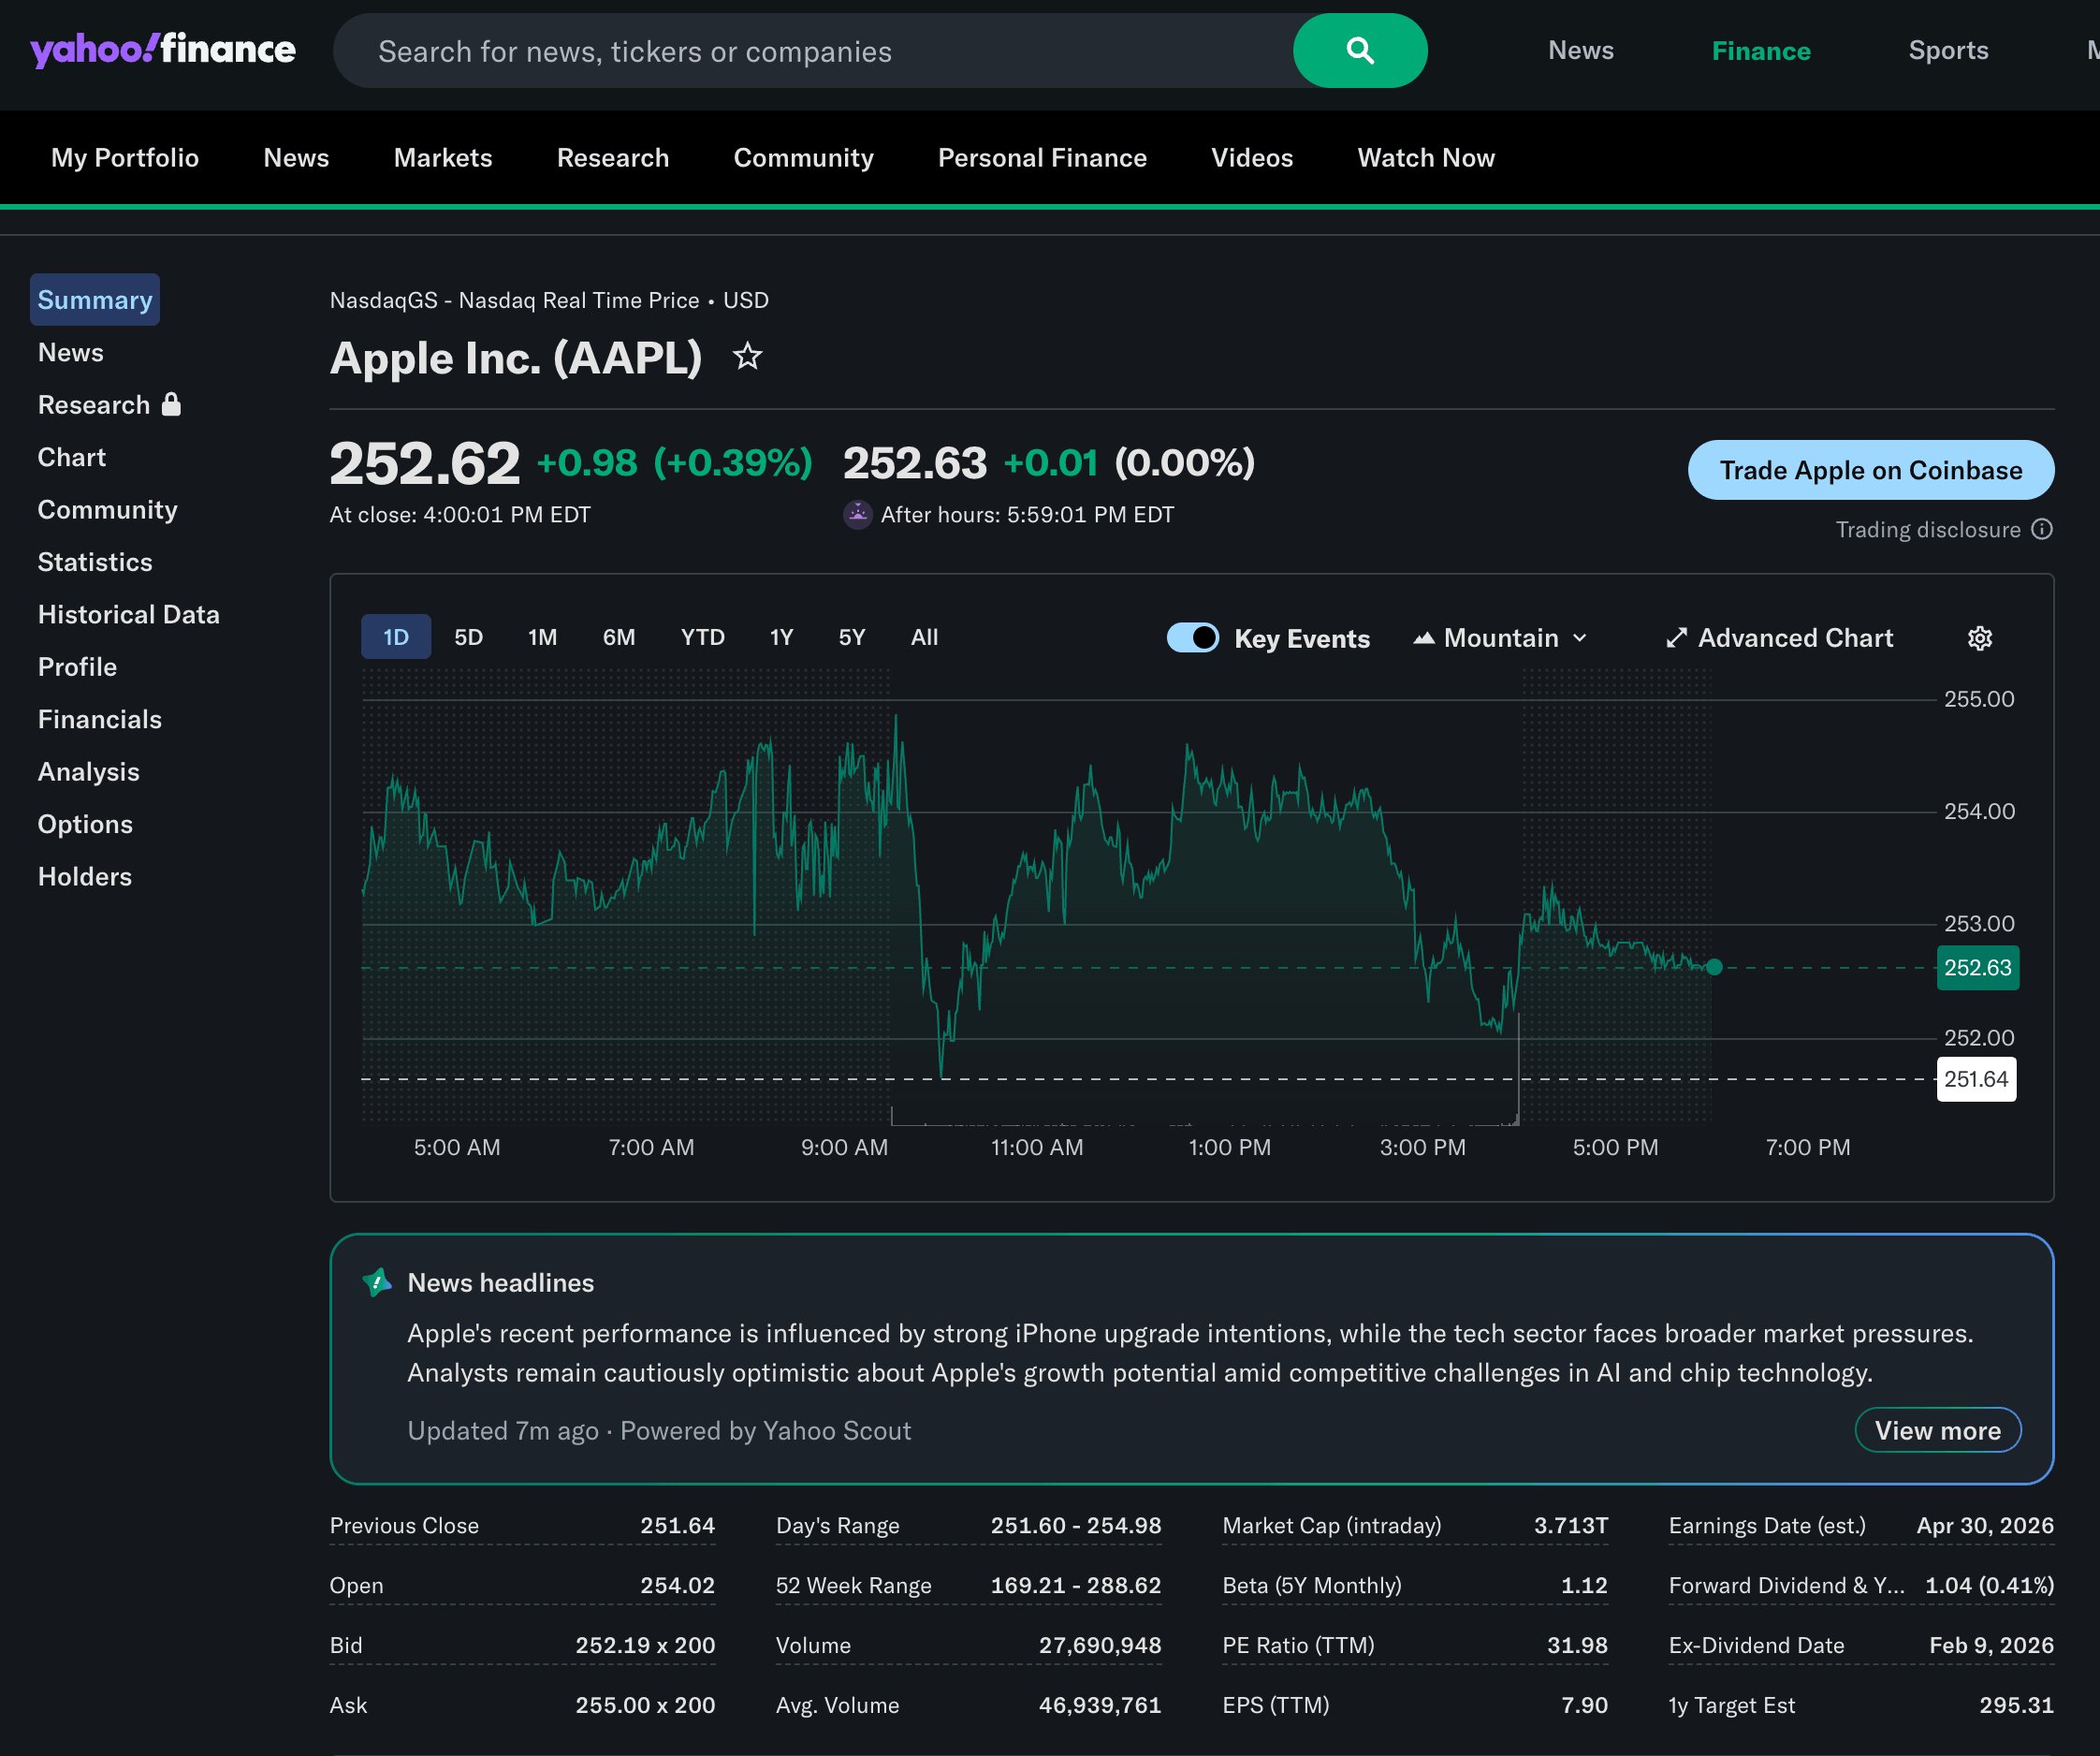
Yahoo Finance allows you to look up the last 5 years of financial statements for free. Beyond that, you'll need to pay for a subscription ($7.95+/month).
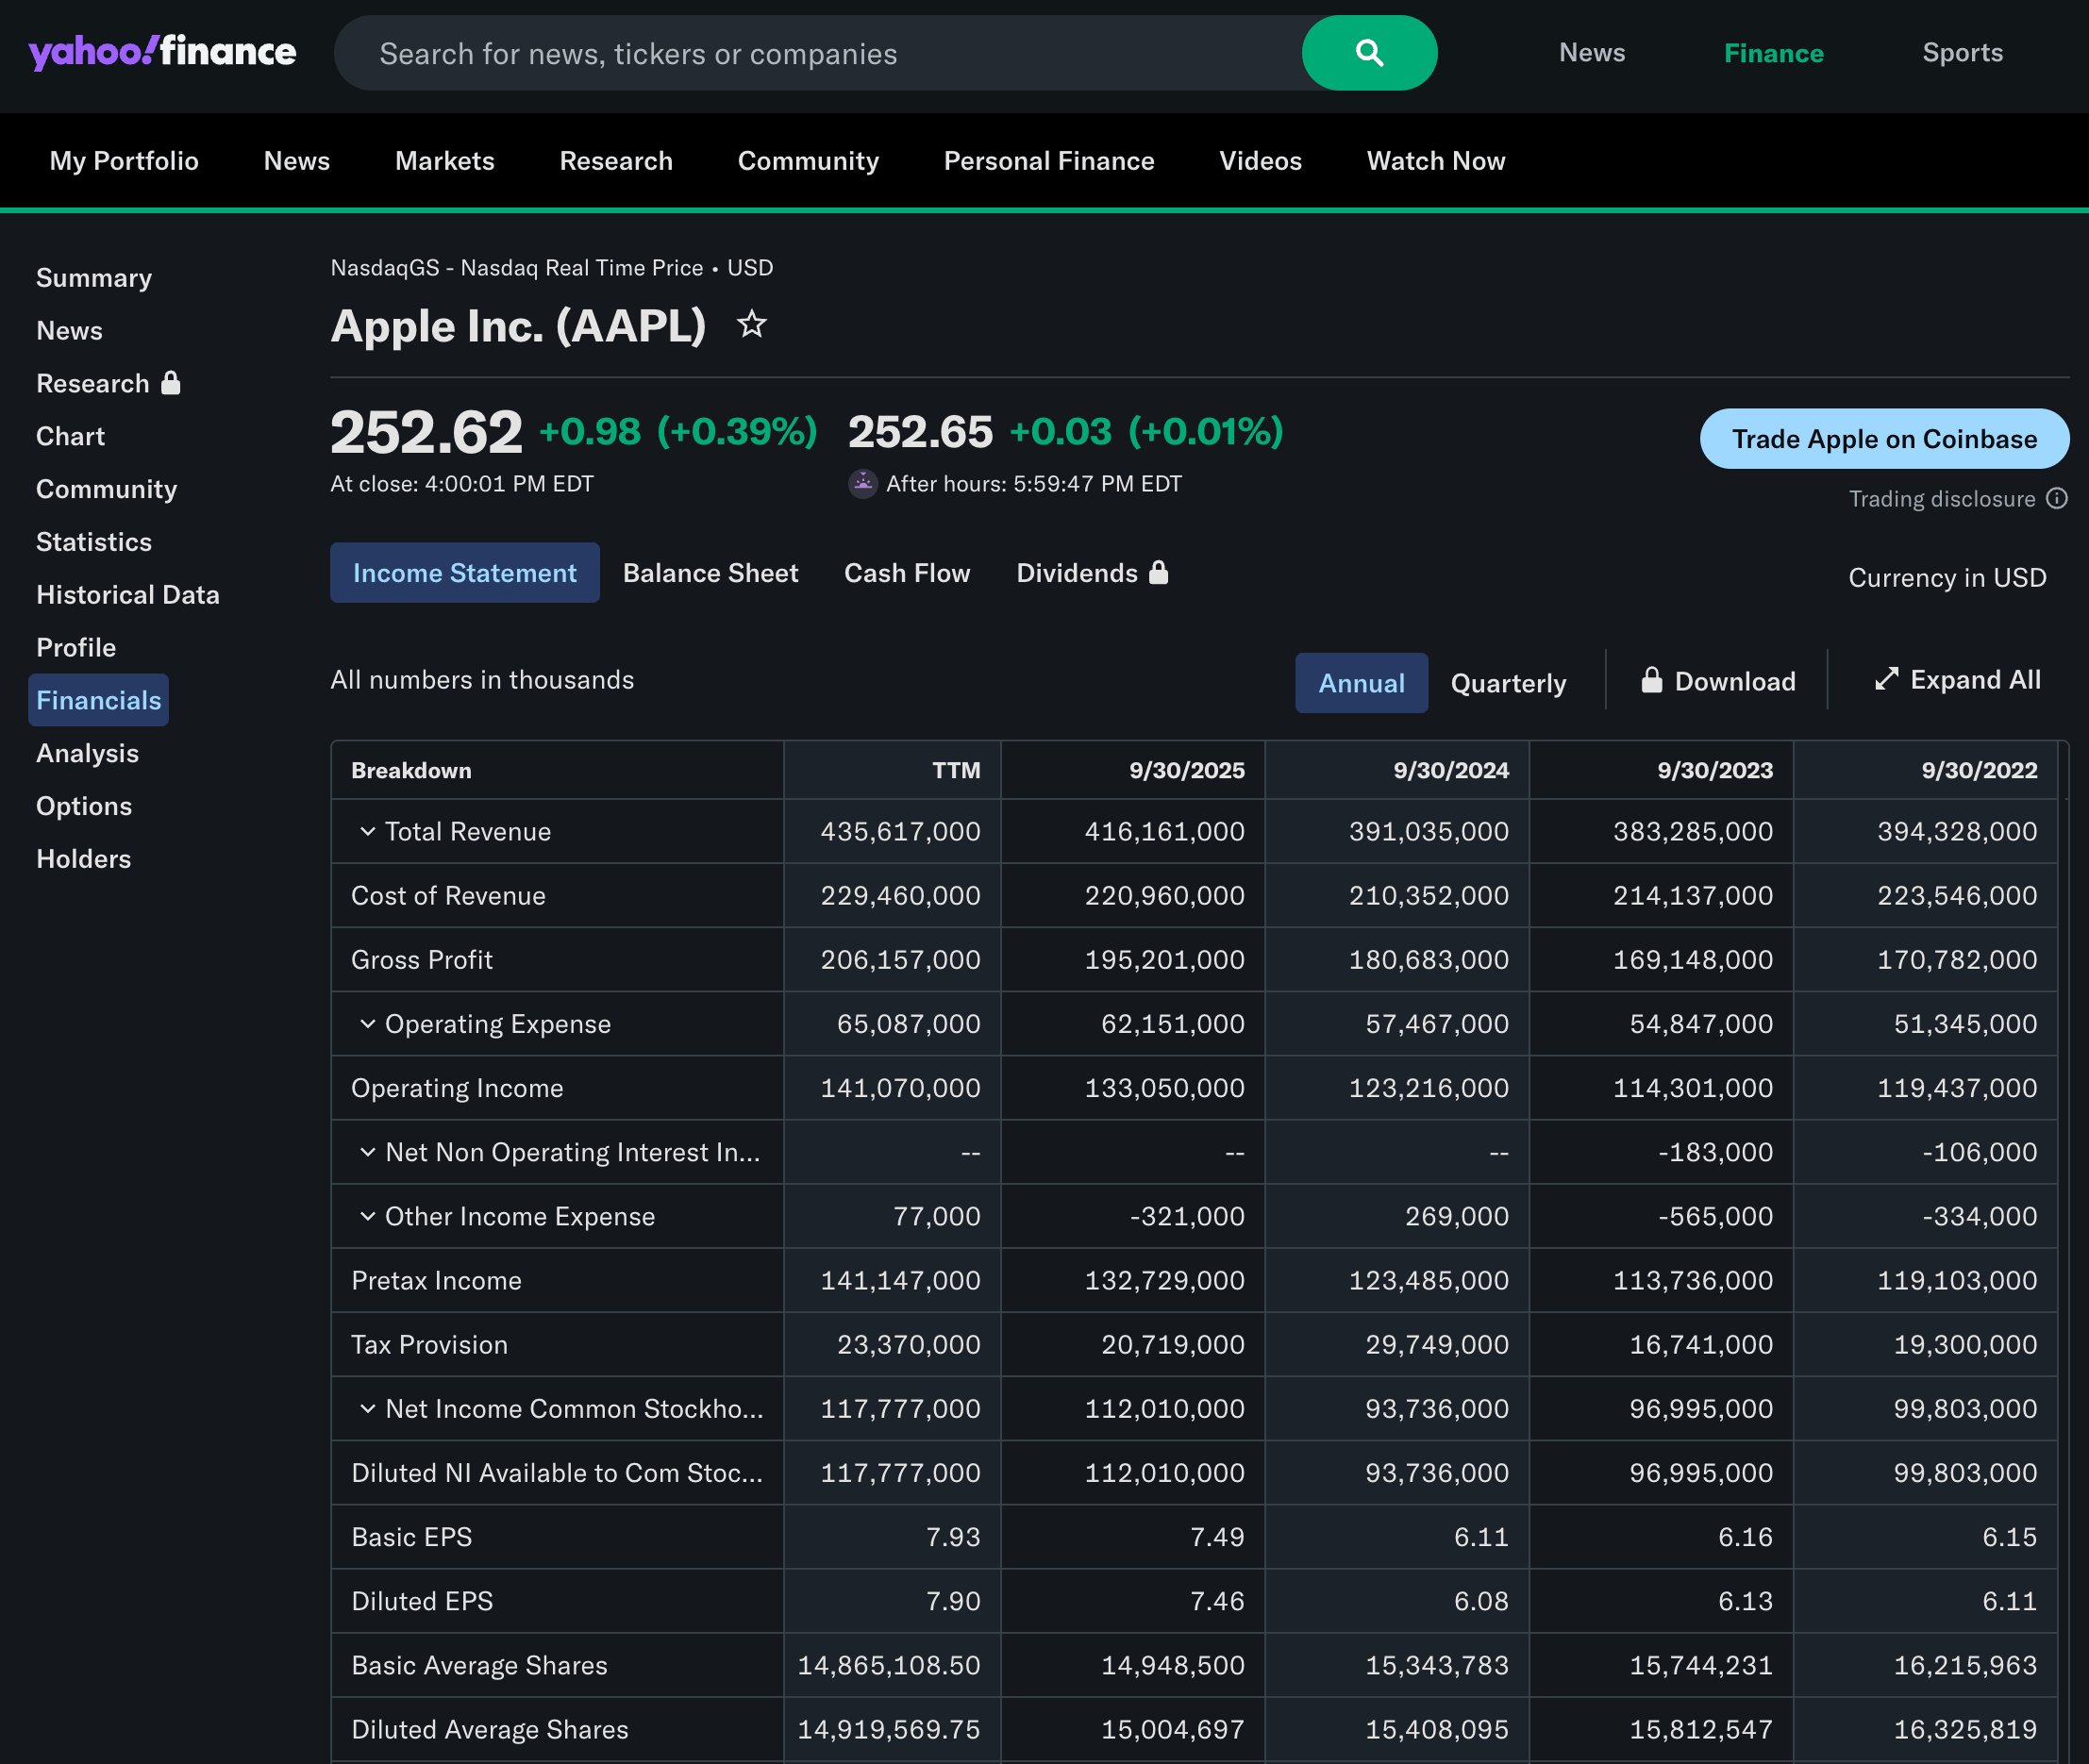
Yahoo Finance also has historical open/close prices, though you'll need a paid subscription to export the data.
MarketWatch is another option for getting all of the same information (basic quotes and statistics, 5 years of financial statements, and historical open/close prices). However, MarketWatch allows you to download up to 1 year of open/close prices for free.
That said, MarketWatch is also full of ads, which can make it laggy and annoying to navigate.
Want a better option? Try Stock Analysis.
2. Koyfin: best for visualizing data and statistics
Koyfin provides access to a wide range of historical financial data, including financial statements, key valuation ratios, and other financial metrics for thousands of stocks.
Instead of only displaying this information in tables, Koyfin allows you to build custom line charts so you can visualize these metrics over time — making it instantly obvious how a business is trending.
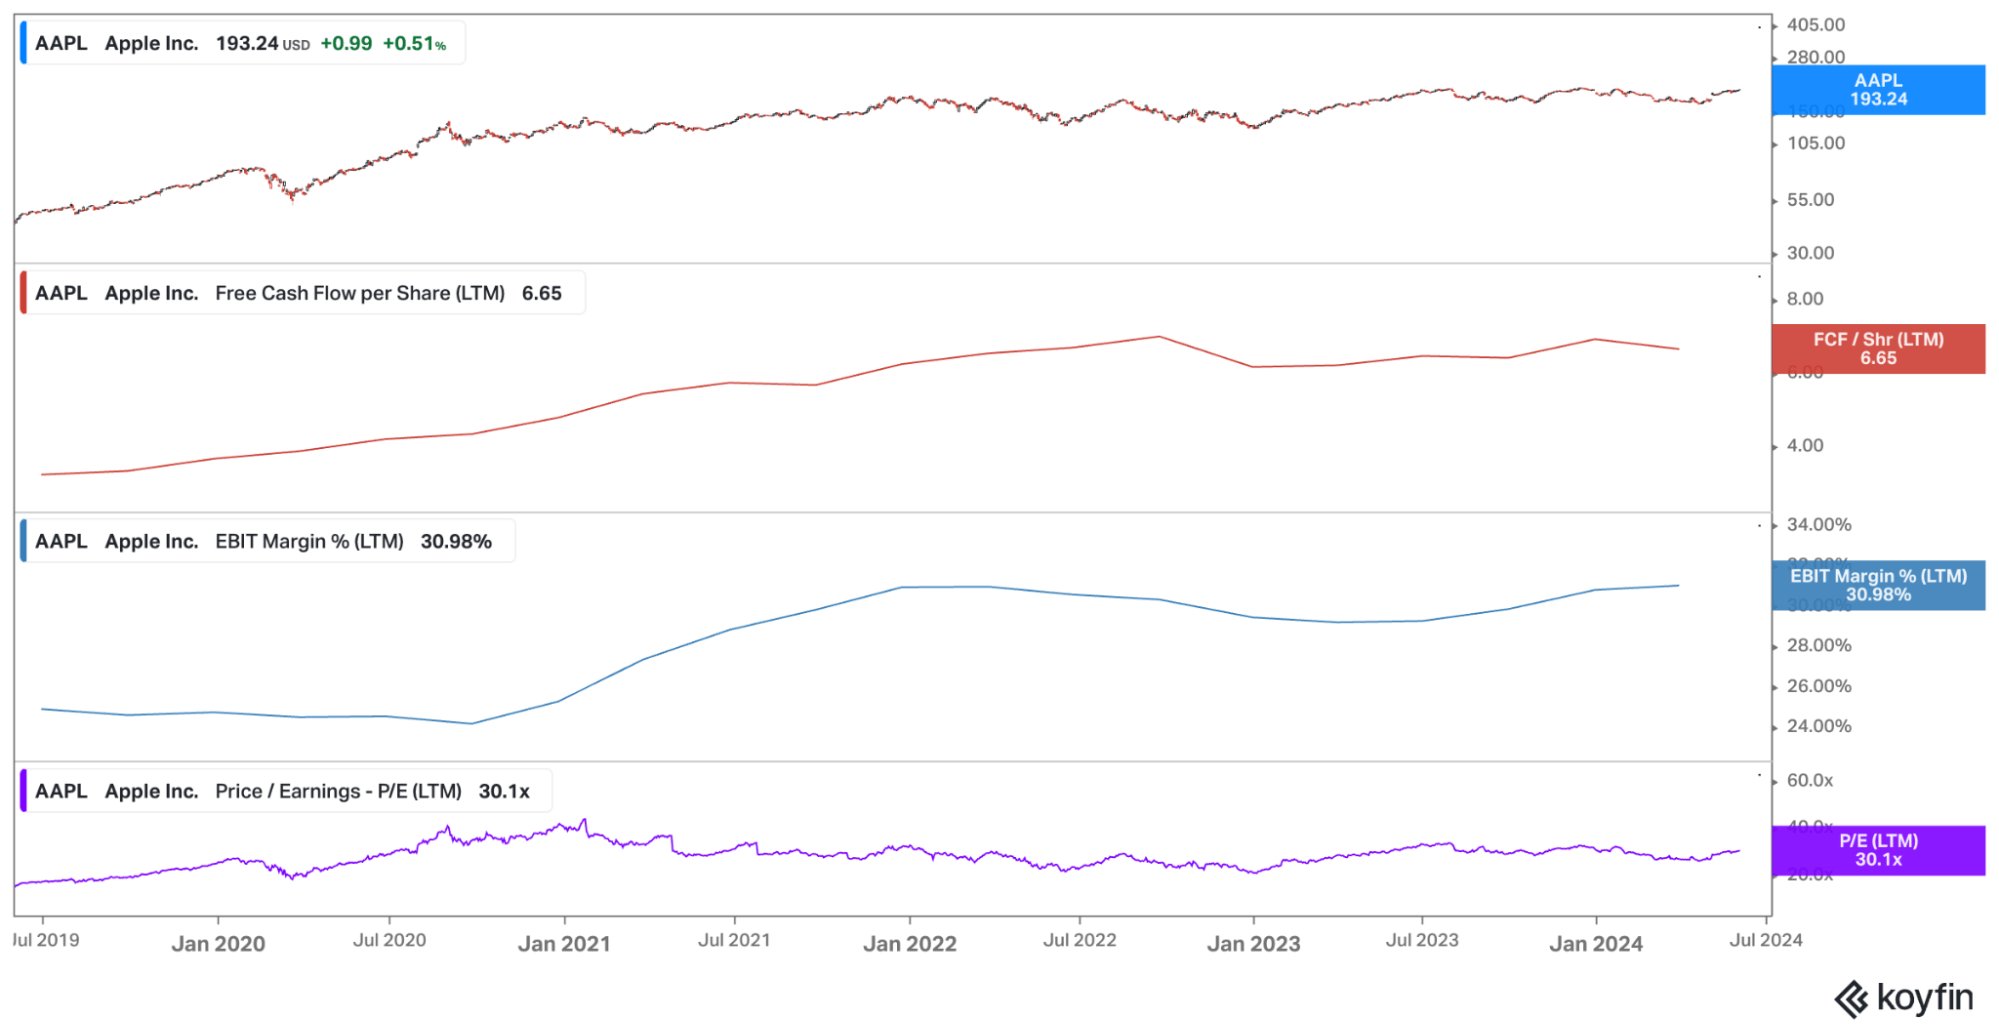
On Koyfin, you can also compare multiple stocks at once, build customizable dashboards, and create custom templates for quickly analyzing stocks.
You can share charts and analyses with other investors in a few clicks, too.
However, while you can get some of this functionality for free, you'll quickly bump into a paywall if you start using the product regularly. It's $49/month or $468/year for their “Plus” plan, or $110/month or $948/year for their most popular “Premium” plan.
You can try it for free with a 7-day trial.
Koyfin also ranks #6 on our list of best stock research websites.
Disclosure: This is an affiliate link. We may receive compensation if you take action through it.
3. EDGAR (SEC): best for granular research and direct access to 10-Ks
Every publicly traded company in the United States is required to file annual (10-K) and quarterly (10-Q) financial reports with the Securities and Exchange Commission (SEC).
These reports are audited, standardized, and — most importantly — packed with detailed financial and business information.
All of them are publicly accessible for free through the SEC's EDGAR database — short for Electronic Data Gathering, Analysis, and Retrieval.
Just enter a ticker symbol, and you'll see its full filing history: earnings reports, proxy statements, insider transactions, registration documents, and more. If it was filed with the SEC, it's there.
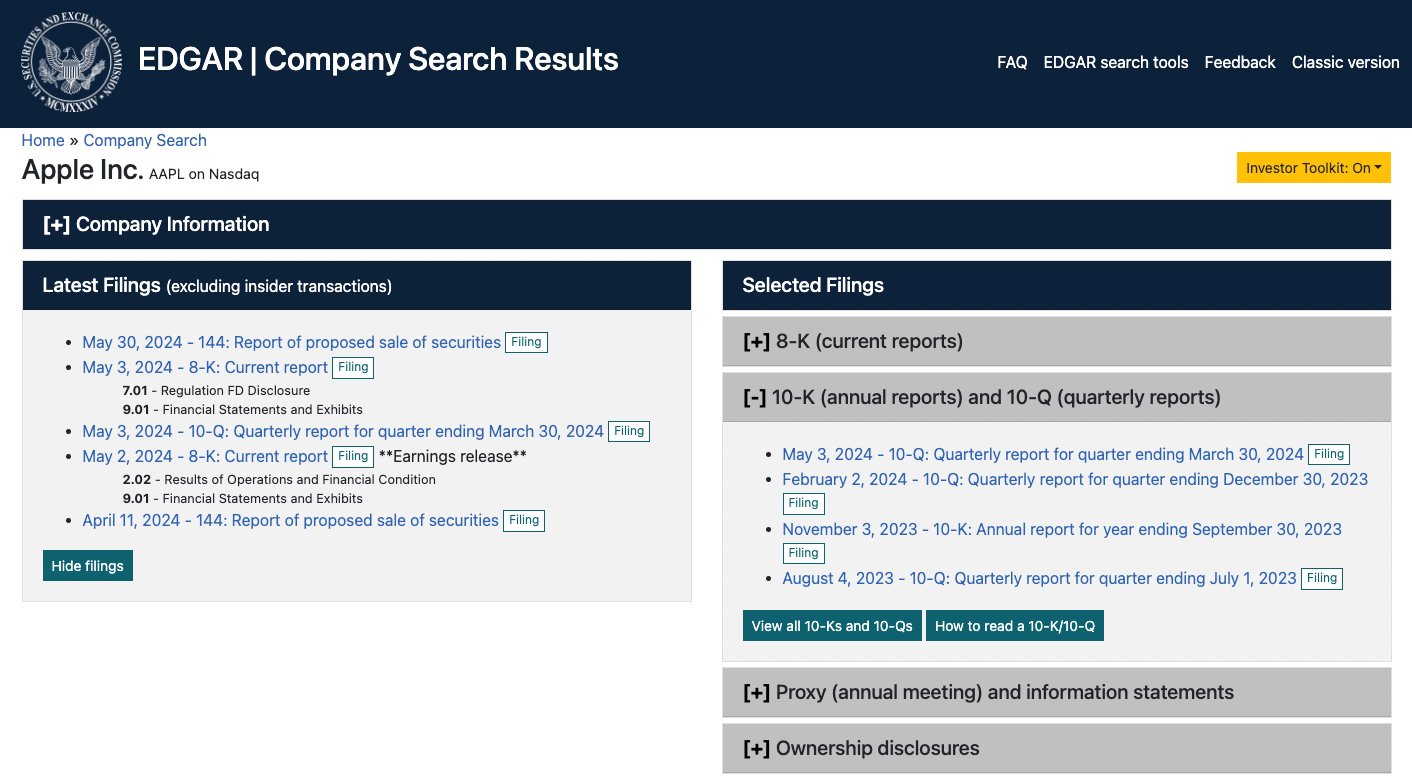
While 10-Ks and 10-Qs aren't exactly light reading, they often contain highly specific data points you may not find anywhere else.
For instance, if you're trying to find the difference in Apple's gross margin between its products and services or how much of its revenue comes from China, you can hunt down this information in these reports.
EDGAR can feel clunky compared to modern websites, but it's one of the most powerful (and overlooked) tools for investors doing deep research.
U.K. investor? Check out Companies House.
4. Investor relations pages: best for company-published reports
Nearly every public company also publishes its annual and quarterly reports on its own website, usually in an "Investor Relations" (IR) section (e.g., see Apple's Investor Relations page).
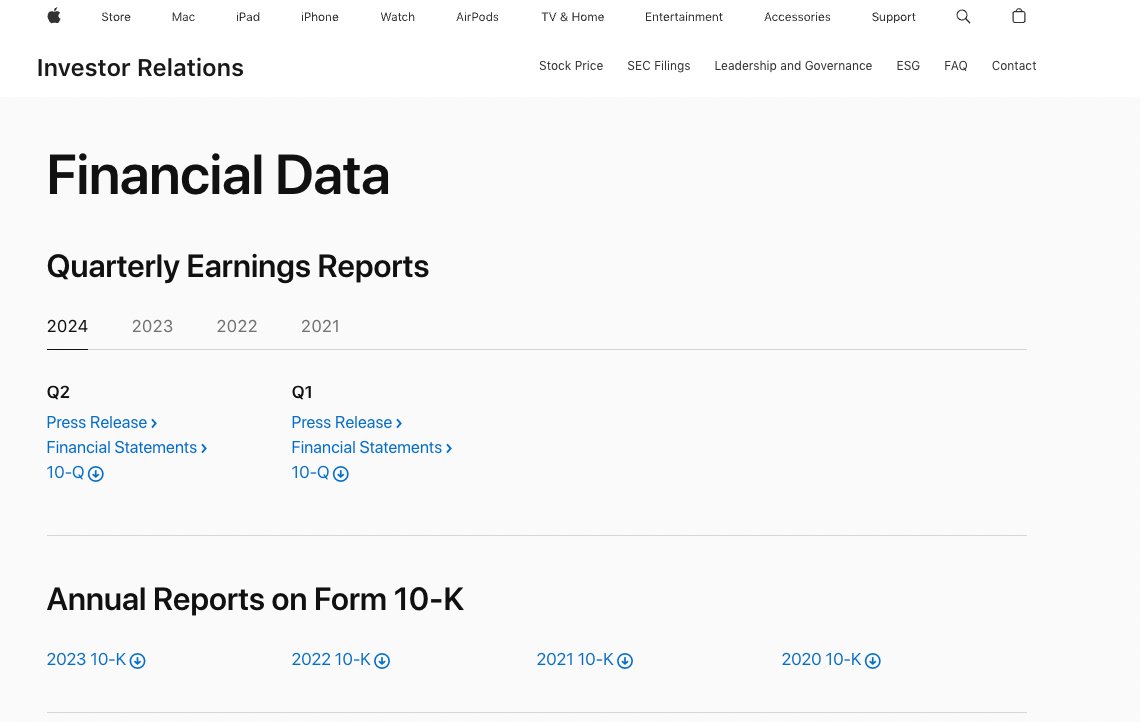
These pages often mirror what's filed with the SEC but present the information in a more digestible, polished format.
Additionally, the financial information is typically summarized, the company's key metrics are more obvious, and many companies also issue press releases to summarize key details.
Furthermore, many companies also turn their reports into PDF documents or slide decks (e.g., see PayPal's latest earnings presentation).
These typically break down performance trends, user growth, margins, forecasts, and future product plans, usually with charts and commentary from the management team.
While not as exhaustive or standardized as SEC filings, investor relations pages often offer the cleanest, most user-friendly view into the information investors care about.
5. Morningstar: best for free dividend history
Morningstar is one of the most overlooked finance websites by retail investors.
It provides clean, objective data that powers many of the world's top financial institutions, and is the primary research center for thousands of financial advisors.
Like Yahoo Finance and MarketWatch, Morningstar provides basic quote information and 5 years of financial statements for free.
It also shows each stock's complete dividend history. Better yet, there's no paywall.
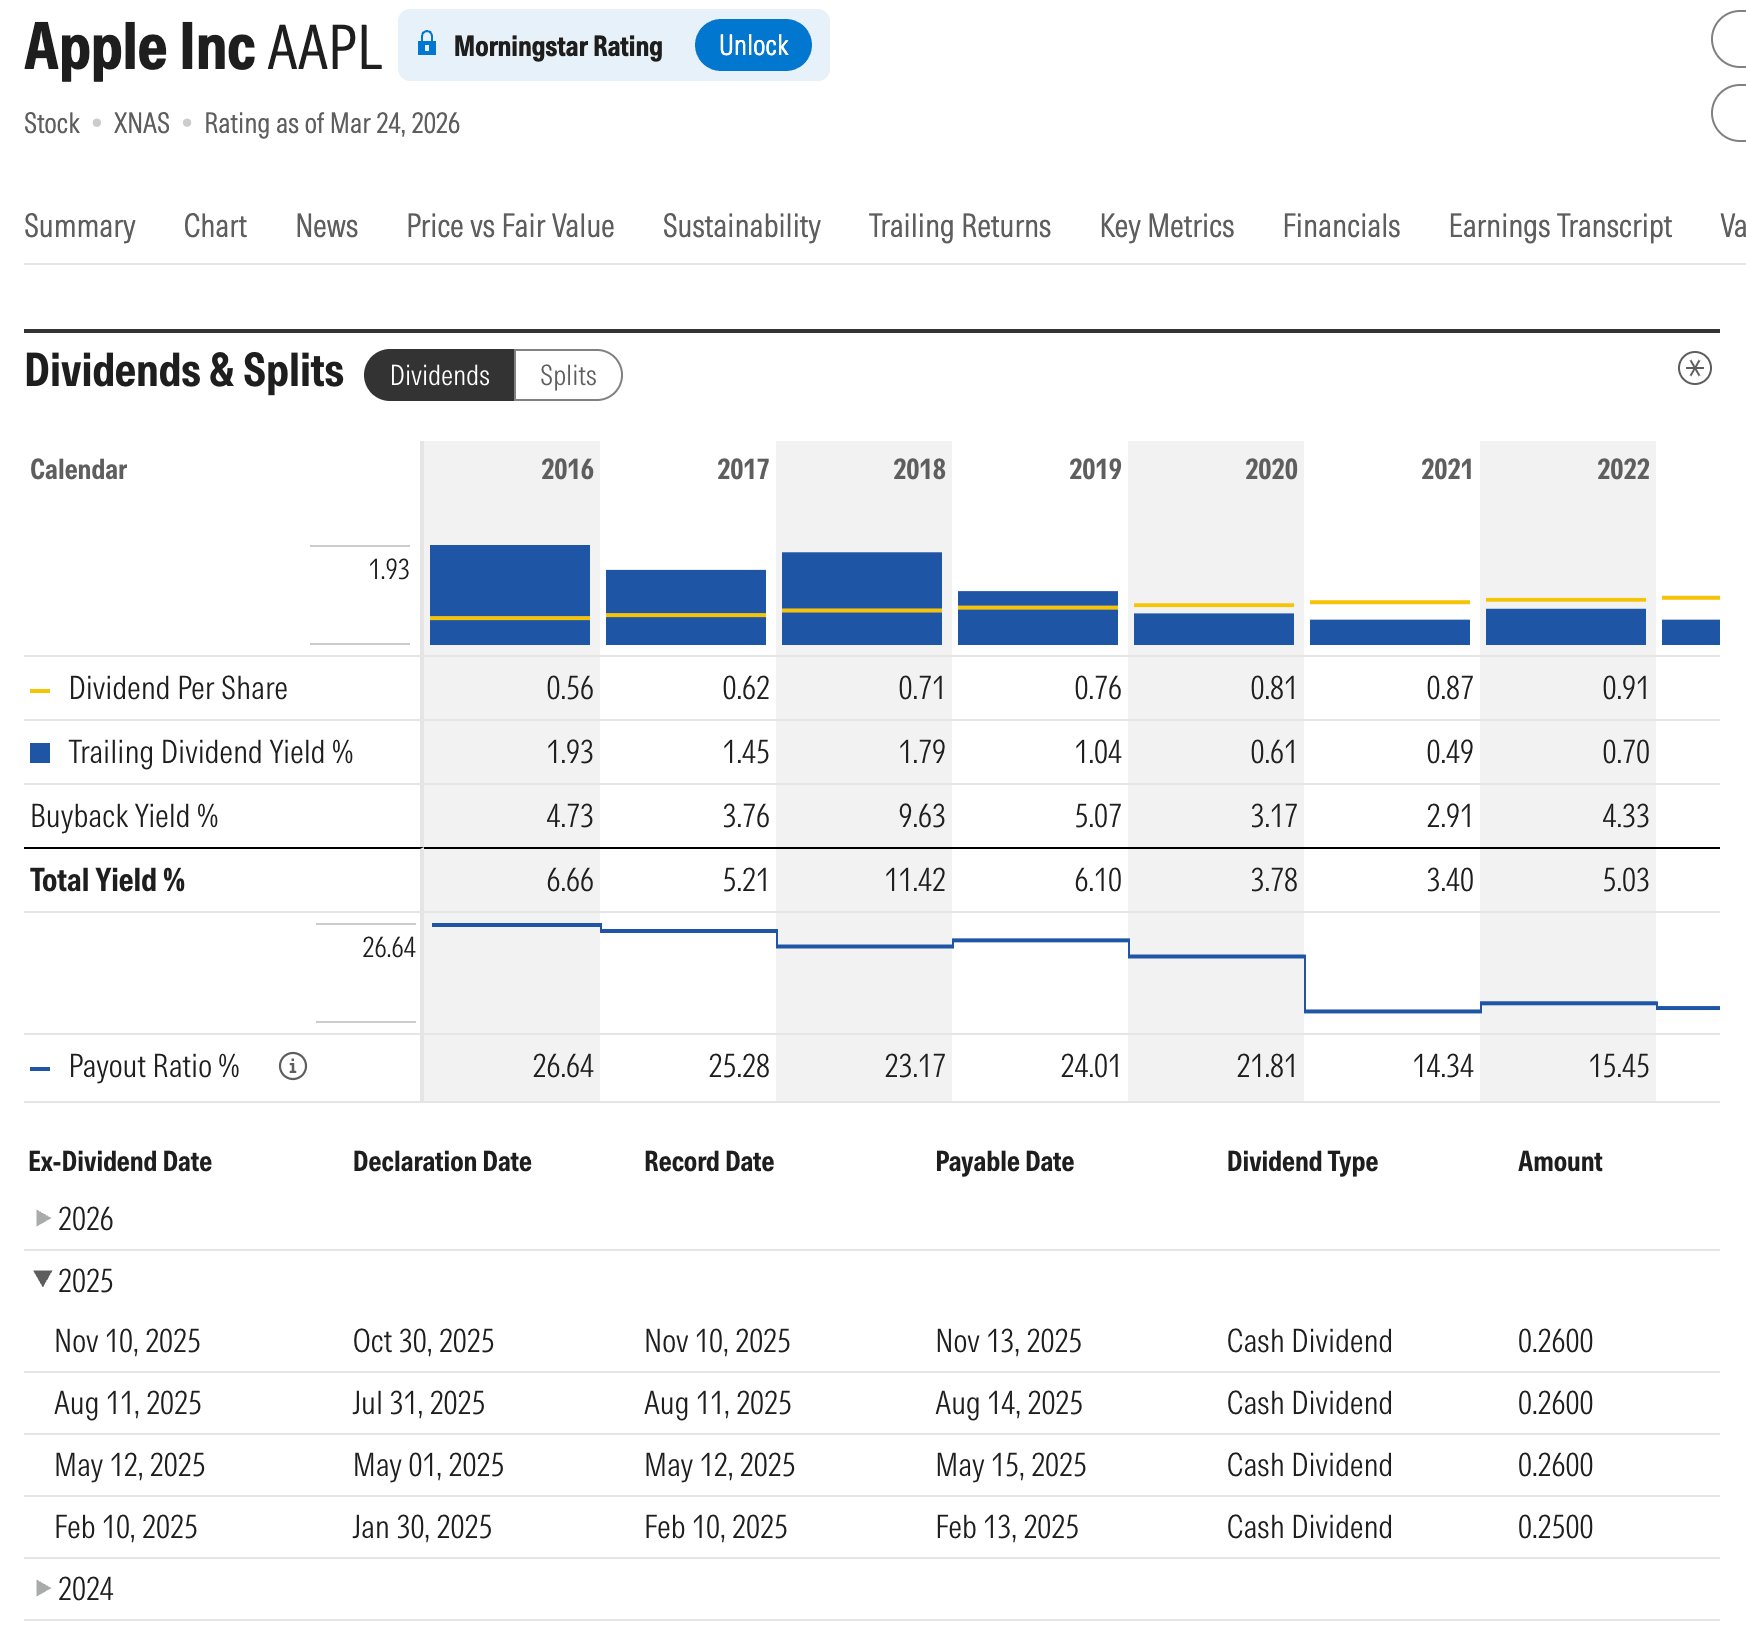
This is an extremely useful reference point, especially for dividend investors.
And once you spend some time on Morningstar, you may find yourself coming back for its independent news and analysis, not just its dividend data.
To unlock all of its research, investment ratings, and portfolio management tools, you can upgrade to Morningstar Investor for $34.95/month or $199/year after a 7-day free trial.
Disclosure: This is an affiliate link. We may receive compensation if you take action through it.
6. Databento, EODHD, Polygon, Marketstack: best historical market data APIs
If you're looking to pull large amounts of data straight into a script or spreadsheet, you're going to need access to an API.
Based on their reliability, broad coverage, and pricing, my favorites are Databento, EODHD, Massive (formerly Polygon), and Marketstack.
Databento: best combination of coverage, ease, and pricing
- Coverage: 3 million symbols, including 20,000+ stocks and ETFs, 1.4 million U.S equity options and 600k options on futures, and futures, spreads, and options from CME, ICE, EEX, and Eurex exchanges.
- Data depth: 15 years of daily history.
Why we like it: Get up and running in minutes. Pricing is usage-based or tiered plans starting at $179/month.
EODHD: most complete all‑in‑one package
- Coverage: Equities in 60+ exchanges, ETFs, mutual funds, options, bonds, FX, crypto — plus splits, dividends, fundamentals, and economic indicators.
- Data depth: Daily history back to the 1970s for most U.S. tickers and 30+ years for fundamentals.
Why we like it: You can get price and fundamentals data with one subscription. Tiered plans start at $19.99/month with a 100,000 daily call limit, so you can prototype cheaply and scale later.
Massive: fastest real‑time U.S. equities & options feed
- Coverage: Every U.S. equity and option, plus indices, forex, crypto, and futures.
- Data depth: Tick‑level trades and quotes back to 2004, minute aggregates to 1998, and daily bars to 1980 on most U.S. tickers.
Why we like it: Sub‑millisecond latency makes it ideal for intraday dashboards and backtests; the free tier handles end‑of‑day pulls, and paid plans (from $29/month) unlock real‑time plus unlimited WebSockets.
Marketstack: best budget pick for global EOD prices
- Coverage: 500,000+ tickers across 70 exchanges worldwide, including many small‑cap venues that bigger APIs skip.
- Data depth: Daily OHLC back to 2000 for most listings, with intraday intervals (1 min–1 hr) for 30,000+ tickers on paid tiers.
Why we like it: Clean JSON responses, an Excel/Google Sheets add‑in for no‑code workflows, and a solid free tier (100 calls/month). Paid plans start at $9.99/month and scale up to 1 million calls without breaking the bank.
Whichever you choose, all four offer free tiers or trial credits, so you can test them without spending any money.
Why is historical financial information useful for investors?
It's very easy to get sucked into the day-to-day fluctuations in the stock market and the latest headlines about what's “moving the markets” today.
However, long-term investors know this tends to lead to overtrading and other adverse behavior.
Instead, it's useful to take a step back, zoom out, and look at the larger trends going on within companies. The best way to do this is by looking at historical financial data and statistics to gauge how a stock is trading relative to its own history or industry.
By examining a company's trends in revenue, profit, and other metrics, long-term investors can make more informed, objective, and unemotional investment decisions.
Programmers, on the other hand, usually need historical stock market data for building and backtesting algorithmic strategies.
Disclaimer: Past performance does not guarantee future results.
Final verdict
In summary, the best website for you will depend on what type of historical stock data you're looking for, as well as whether you're willing to pay for it.
Yahoo Finance and MarketWatch provide a few years worth of financial statements for free, but you'll need to upgrade to paid subscriptions beyond that. For free dividend history, check out Morningstar.*
*Or you could just get all of these things, for free, from Stock Analysis.
Koyfin is a great tool for visualizing a company's financial performance, stock ratios, and other metrics over time. You can try it with a 7-day free trial.
The SEC's EDGAR database, as well as companies' investor relations pages, will give you direct access to 10-Ks and are great resources for digging deep into a company.
For programmers, Databento, EODHD, Massive, and Marketstack are excellent API options.