
What Are the Average Stock Market Returns by Month?

Some months have better average stock market returns than others.
The stretch from November to May tends to be positive, while June to September is often flat or negative. This is why the phrase "sell in May and go away" was coined.
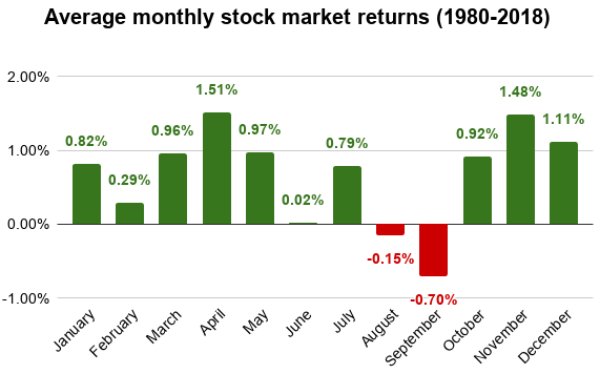
From 1980–2018, April has been the best month of the year for the stock market, with an average 1.52% gain in the S&P 500. However, September has been the worst month, with average returns of -0.70%.
The average monthly S&P500 stock market returns from 1980 to 2019 were:
- January: +0.82%
- February: +0.29%
- March: +0.96%
- April: +1.51%
- May: +0.97%
- June: +0.02%
- July: +0.79%
- August: -0.15%
- September: -0.70%
- October: +0.92%
- November: +1.48%
- December: +1.11%
- Average: +0.67%
Here's a chart that shows this visually:
How are we doing in 2019?
Stock returns in 2019 have been remarkably consistent with the average return of the past three decades.
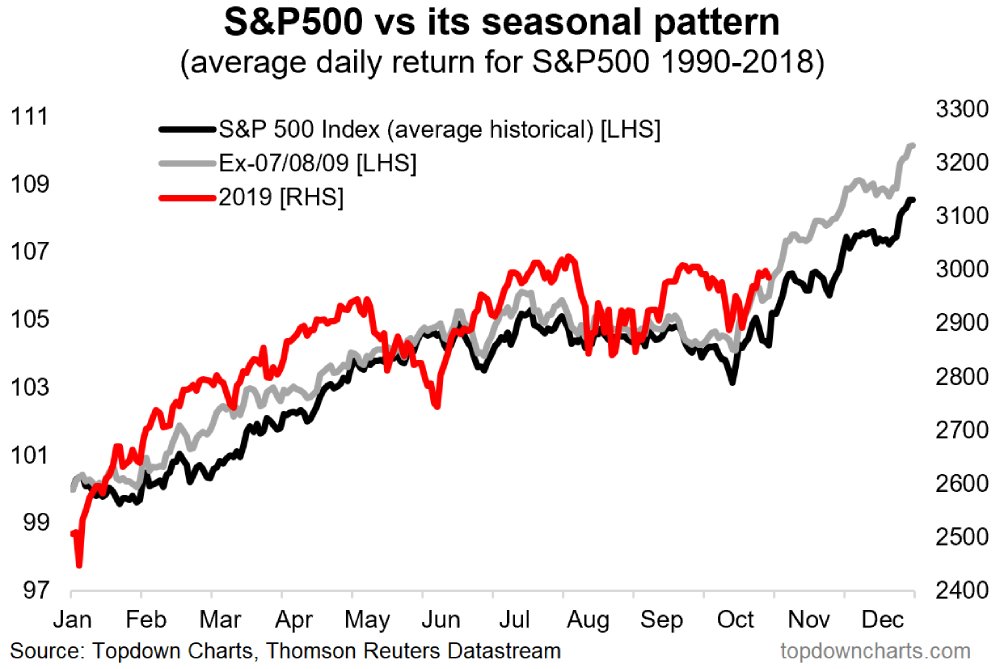
Photo Source: Topdown Charts
Of course, this does not guarantee that returns at the end of 2019 are going to be good. The annual trend is just based on averages.
For example, the last three months of 2018 were terrible for the stock market, where the S&P500 tanked 19.9% from its peak.