TC Energy Corporation (FRA:TRS)
 Germany · Delayed Price · Currency is EUR
 | Market Cap | 57.12B +26.0% |
| Revenue (ttm) | 9.47B +10.7% |
| Net Income | 2.11B -25.1% |
| EPS | 2.03 -26.2% |
| Shares Out | n/a |
| PE Ratio | 27.05 |
| Forward PE | 23.14 |
| Dividend | 2.13 (3.89%) |
| Ex-Dividend Date | Mar 31, 2026 |
| Volume | 345 |
| Average Volume | 28 |
| Open | 54.79 |
| Previous Close | 53.87 |
| Day's Range | 54.79 - 54.79 |
| 52-Week Range | 39.47 - 56.33 |
| Beta | n/a |
| RSI | 53.73 |
| Earnings Date | Apr 30, 2026 |
About TC Energy
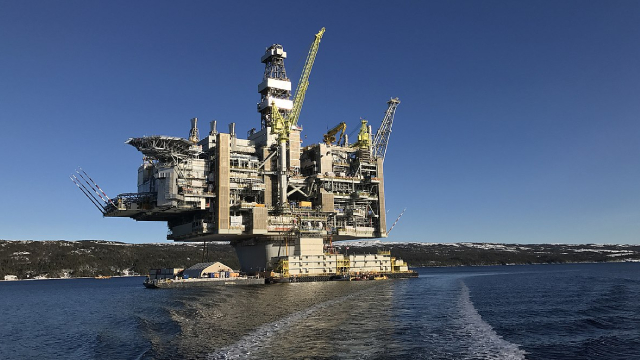
TC Energy Corporation operates as an energy infrastructure company in Canada, the United States, and Mexico. It operates through four segments: Canadian Natural Gas Pipelines; U.S. Natural Gas Pipelines; Mexico Natural Gas Pipelines; and Power and Energy Solutions. The company builds and operates a network of 94,171 kilometers of natural gas pipelines, which transports natural gas from supply basins to local distribution companies, power generation plants, industrial facilities, interconnecting pipelines, LNG export terminals, and other busines... [Read more]
Financial Performance
In 2025, TC Energy's revenue was 15.24 billion, an increase of 10.66% compared to the previous year's 13.77 billion. Earnings were 3.40 billion, a decrease of -25.99%.
Financial numbers in CAD Financial StatementsNews
Canada driving investment away, needs major changes to regulatory approach: executive
TC Energy chief executive officer Francois Poirier is again calling for major changes to Canada’s regulatory approach, warning the country is driving investment away by slowing down big energy project...
June 18th Options Now Available For TC Energy (TRP)
Investors in TC Energy Corp (Symbol: TRP) saw new options begin trading today, for the June 18th expiration. One of the key data points that goes into the price an option buyer is willing to pay, is t...
TC Energy (TRP) Advances Coastal GasLink Phase 2 with LNG Canada Agreements
TC Energy (TRP) Advances Coastal GasLink Phase 2 with LNG Canada Agreements

TC Energy inks new deals for GasLink expansion
TC Energy said on Wednesday that its Coastal GasLink pipeline project has signed commercial agreements with LNG Canada to advance the project's second phase.
The Zacks Analyst Blog Highlights Chevron, Kinder Morgan and TC Energy
Chevron, Kinder Morgan and TC Energy stand out as dividend-paying energy giants offering stability and income amid volatile oil prices and supply disruptions.
Iran war makes second phase of LNG Canada more likely, TC Energy CEO says
The disruption to global liquefied natural gas supplies caused by the Iran war makes it more likely that a second stage of Canada's massive LNG Canada facility will be built, the CEO of Canadian pipe...
TC Energy could be open to return to B.C. LNG pipeline project it sold two years ago as global gas crunch threatens
CEO says Iran war has bolstered the outlook for the Ksi Lisims LNG project which will need a pipeline partner

TC Energy Corporation (TRP) Closes the Market
Toronto, Ontario--(Newsfile Corp. - March 19, 2026) - François Poirier, President and Chief Executive Officer, TC Energy Corporation ("TC Energy" or the "Company") (TSX: TRP) and members of the TC Ene...
TC Energy (TRP) CEO Criticizes Slow Project Approval Process
TC Energy (TRP) CEO Criticizes Slow Project Approval Process
TC Energy Could Invest Billions More in US, CEO Says
François Poirier, CEO of TC Energy, says the Canadian pipeline and energy firm could invest billions of more dollars in the US. He talks about the importance of having energy flow freely between the U...

NYSE Content Update: Premium Drink Giant Diageo to Mark St. Patrick's Day by Ringing the Bell
NYSE issues a pre-market daily advisory direct from the trading floor. NEW YORK, March 17, 2026 /PRNewswire/ -- The New York Stock Exchange (NYSE) provides a daily pre-market update directly from the ...

We're paying the price for underinvestment in energy infrastructure: TC Energy CEO François Poirier
TC Energy CEO François Poirier joins 'Squawk Box' to discuss the state of the global energy markets, impact of the Iran war, North America's energy infrastructure, energy consumption from AI data cent...

Keystone XL Revival Gains Momentum as New Pipeline Plan Emerges
An oil pipeline crossing the Canada-US border may be back on government agendas, as the proponent, South Bow Corp (TSX:SOBO), looks to revive the long-dead project. TC Energy (TSX:TRP) spun the oil pi...
Posthaste: This dormant pipeline needs to be restarted for the sake of Canada, economists say
National Bank of Canada economists think TC Energy pipeline could tick all kinds of national boxes

Parex Resources Announces Nomination of Six Directors to GeoPark's Board
CALGARY, Alberta, Feb. 20, 2026 (GLOBE NEWSWIRE) -- Parex Resources Inc. ("Parex" or the "Company") (TSX: PXT), which has an approximate 11.8% ownership position in GeoPark Limited ("GeoPark") (NYSE:...

This Rivian Automotive Analyst Turns Bearish; Here Are Top 5 Downgrades For Tuesday
Top Wall Street analysts changed their outlook on these top names. For a complete view of all analyst rating changes, including upgrades, downgrades and initiations, please see our analyst ratings pag...
RBC Capital Maintains 'Outperform' on TC Energy (TRP), Raises Price Target | TRP Stock News
RBC Capital Maintains 'Outperform' on TC Energy (TRP), Raises Price Target | TRP Stock News
TC Energy Corp (TRP) Trading Down 3.78% on Feb 17
TC Energy Corp (TRP) Trading Down 3.78% on Feb 17
TC Energy (TRP) Receives Downgrade; Price Target Raised to $85 | TRP Stock News
TC Energy (TRP) Receives Downgrade; Price Target Raised to $85 | TRP Stock News
TC Energy Corp (TRP) Q4 2025 Earnings Call Highlights: Strong EBITDA Growth and Strategic ...
TC Energy Corp (TRP) Q4 2025 Earnings Call Highlights: Strong EBITDA Growth and Strategic Project Advancements
Q4 2025 TC Energy Corp Earnings Call Transcript
Q4 2025 TC Energy Corp Earnings Call Transcript
TC Energy shares rise after fourth-quarter revenue growth and 2026 EBITDA outlook
TC Energy Corporation (NYSE, TSX: TRP) closed at $64.50, up 5.05% on the session, after reporting fourth-quarter and full-year 2025... The post TC Energy shares rise after fourth-quarter revenue growt...

Power demand for AI is rapidly accelerating, says TC Energy CEO
Francois Poirier, TC Energy CEO, joins 'Money Movers' to discuss the company's earnings, growth strategy, AI demand, and more.
TC Energy Corp (TRP) Trading 3.54% Higher on Feb 13
TC Energy Corp (TRP) Trading 3.54% Higher on Feb 13

TC Energy Tops Q4 Profit Estimate on Strong U.S. Natural Gas Demand
TC Energy Corporation beat analyst estimates for fourth-quarter profits amid soaring demand for natural gas in the United States which boosted its pipeline flows to an all-time delivery record early t...