Applied Materials, Inc. (LON:0R1A)
 London · Delayed Price · Currency is GBP · Price in USD
 | Market Cap | 210.80B +119.6% |
| Revenue (ttm) | 20.78B +2.1% |
| Net Income | 5.77B +23.6% |
| EPS | 7.19 +27.5% |
| Shares Out | n/a |
| PE Ratio | 36.50 |
| Forward PE | 29.25 |
| Dividend | 1.38 (0.39%) |
| Ex-Dividend Date | Feb 19, 2026 |
| Volume | 3,517 |
| Average Volume | 9,644 |
| Open | 353.62 |
| Previous Close | 356.50 |
| Day's Range | 336.00 - 356.00 |
| 52-Week Range | 116.00 - 399.53 |
| Beta | 1.63 |
| RSI | 48.76 |
| Earnings Date | May 14, 2026 |
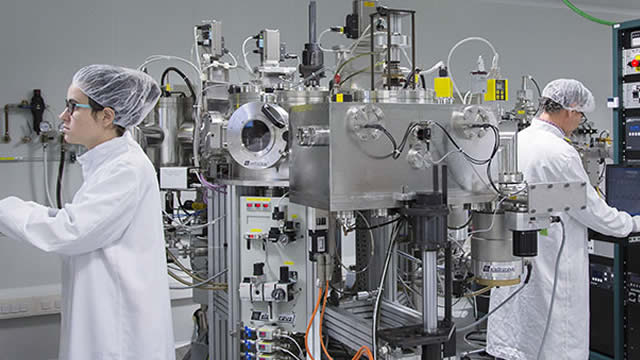
About Applied Materials
Applied Materials, Inc. provides materials engineering solutions, equipment, services, and software to the semiconductor and related industries in the United States, China, Korea, Taiwan, Japan, Southeast Asia, Europe, and internationally. The company operates through Semiconductor Systems and Applied Global Services (AGS) segments. The Semiconductor Systems segment includes semiconductor capital equipment to enable materials engineering steps, including etch, rapid thermal processing, deposition, chemical mechanical planarization, metrology an... [Read more]
Financial Performance
In fiscal year 2025, Applied Materials's revenue was $28.37 billion, an increase of 4.39% compared to the previous year's $27.18 billion. Earnings were $7.00 billion, a decrease of -2.49%.
Financial numbers in USD Financial StatementsNews

These 2 chip stocks were added to Deutsche Bank's list of top tech picks
Applied Materials shares look set to continue to benefit from recent chip-sector strength, while Broadcom's stock should rebound as AI-chip revenue grows.


Applied Materials: The AI Gold Rush Everyone Is Missing
Applied Materials is central to AI chip manufacturing, providing essential tools for advanced semiconductor production. AMAT recently surpassed Wall Street expectations, signaling robust demand across...

Applied Materials Raises Quarterly Cash Dividend by 15 Percent
SANTA CLARA, Calif., March 13, 2026 (GLOBE NEWSWIRE) -- Applied Materials, Inc. today announced that its Board of Directors has approved a 15-percent increase in the quarterly cash dividend, from $0.4...
Applied Materials and SK Hynix partner for next-gen AI memory development
Applied Materials said on Tuesday it has partnered with SK Hynix to accelerate the development of advanced DRAM and high-bandwidth memory crucial for artificial intelligence and high-per...

Applied Materials and SK hynix Announce Long-Term R&D Partnership to Accelerate AI Memory Innovation at EPIC Center in Silicon Valley
SANTA CLARA, Calif., March 10, 2026 (GLOBE NEWSWIRE) -- Applied Materials, Inc. today announced a long-term collaboration agreement with SK hynix Inc. to accelerate the development and deployment of n...
Applied Materials, Inc. (AMAT) Presents at 2026 Cantor Global Technology & Industrial Growth Conference Transcript
Applied Materials, Inc. (AMAT) Presents at 2026 Cantor Global Technology & Industrial Growth Conference Transcript

Applied Materials and Micron Partner To Advance U.S. Innovation in Next-Generation AI Memory Solutions
SANTA CLARA, Calif., March 10, 2026 (GLOBE NEWSWIRE) -- Applied Materials, Inc. today announced it is working with Micron Technology to develop next-generation DRAM, high-bandwidth memory (HBM) and NA...

Applied Materials, Inc. (AMAT) Presents at Morgan Stanley Technology, Media & Telecom Conference 2026 Transcript
Applied Materials, Inc. (AMAT) Presents at Morgan Stanley Technology, Media & Telecom Conference 2026 Transcript

Columbia Balanced Fund Q4 2025 Contributors And Detractors
Lilly delivered exceptional performance over the period, driven by sustained strength in its diabetes and obesity portfolio. Applied Materials outperformed during the quarter, as AI-driven wafer-fab i...

Applied Materials Awards Suppliers for Outstanding Performance
SANTA CLARA, Calif., Feb. 24, 2026 (GLOBE NEWSWIRE) -- Applied Materials, Inc. today announced the recipients of Supplier Excellence Awards for contributions made to Applied's business over the past y...
AMAT Stock Key Score Climbs As AI Demand And Operational Efficiency Drive Q1 Surge
The ranking improvement moves the company into the top 10% of its peer group, driven by record-breaking operational efficiency and an aggressive pivot toward artificial intelligence (AI) infrastructur...
The Big 3: AMAT, SNDK, RTX
Tim Bohen (@Stockstotrade) is back with his Big 3, all of which have seen significant rallies over the last few months. He makes the case for continuing runs in Applied Materials (AMAT), SanDisk (SNDK...
The Big 3: VZ, DXCM, AMAT
Dan Deming sees the rotation trade continuing if markets can hold recent momentum this trading week. As for the Big 3, he sees a breakout candidate in Verizon (VZ), DexCom's (DXCM) potential to contin...
Applied Materials Shares Rise ~4% Following Key Trading Signal
Applied Materials Inc (NASDAQ:AMAT) experienced a significant Power Inflow alert, a key bullish indicator that is closely tracked by traders who value order flow analytics, specifically institutional ...
The Big 3: AMAT, C, AAPL
There are opportunities in the AI & crypto trades investors may not be looking enough at, says Jessica Inskip (@jessicainskip). She turns to Applied Materials (AMAT) as a bullish indictor for the semi...
Is Applied Materials The New Sector King?
Applied Materials' stock has achieved a remarkable 95% return over the previous year during a “Giga-cycle” for semiconductor equipment fueled by AI demand. But how does it genuinely compare to major c...

Applied Materials to Participate in Upcoming Investor Conferences
SANTA CLARA, Calif., Feb. 17, 2026 (GLOBE NEWSWIRE) -- Applied Materials, Inc. today announced that members of its management team will participate in fireside chats at upcoming investor conferences.
Applied Materials Surges On 20% Growth Guidance, Is The Stock Now Fully Valued?
Applied Materials jumps on 20% growth guidance as AI fab equipment demand accelerates. Strong 2nm and GAA innovation positions AMAT at semiconductor manufacturing's leading edge. Reshoring and U.S. fa...
Applied Materials: Little Opportunity Left After A Monstrous Run
Applied Materials, Inc. delivered resilient Q1 results, with robust DRAM revenue and strong cash flow, but China risks persist. Q2 guidance is notably strong, projecting 8% revenue growth and 10% EPS ...
Applied Materials Stock Jumps as AI-Driven Chip Demand Lifts Profits
Wall Street is excited about Applied Materials' quarterly profits.
The Big 3: RIVN, CSX, AMAT
@Stockstotrade's Tim Bohen is back for another round of Big 3 picks to close the trading week. He explains his "contrarian take" on Rivian (RIVN), why CSX Corp. (CSX) has room to run in the rail trade...
Applied Materials jumps as AI demand drives chipmaking tool orders
Applied Materials' shares jumped 11.7% in premarket trading on Friday as investors bet that surging AI demand and a tightening memory market will continue to drive orders for the company's chipmaking ...