VOO vs VTI: Which ETF Is a Better Investment?

Passive investing in index funds is more popular than ever.
There is a good reason for this. Research shows that passively managed index funds provide higher returns than over 90% of active professional fund managers.
However, there are thousands of funds and hundreds of companies making them. Not all of them are equal.
Of the many companies that provide index funds, Vanguard is one of the biggest and most trusted. Millions of people invest in their funds, and they collectively have over $7.7 trillion in assets under management as of 2024.
Two of Vanguard's exchange-traded funds (ETFs) are particularly popular. Both of them provide exposure to the U.S. stock market:
- VOO: This ETF tracks the S&P 500 Index and holds 505 stocks.
- VTI: This is a more diversified ETF that holds all the S&P 500 stocks, but also many mid-cap and small-cap stocks. It holds 3,761 stocks in total.
This article examines the differences between VOO and VTI and which one is likely to be a better investment.
VOO: Vanguard S&P 500 ETF
- Assets: $355.1 billion
- Holdings: 505 stocks
- Dividend yield: 1.43%
- Expense ratio: 0.03%
The Vanguard S&P 500 ETF (VOO) is one of the biggest index funds that tracks the S&P500, with over $300 billion in assets under management. It also has one of the lowest expense ratios, making it very popular among passive index investors.
Like other S&P 500 ETFs, it holds a market-cap weighted index of the 505 stocks in the S&P 500. All of these are U.S.-based companies that are categorized as "large-cap," meaning they have market capitalizations higher than $10 billion.
Even though the S&P 500 only represents 500 companies, some of them have two or more classes of stock. This explains why the index has 505 stocks, not 500.
An example of a company with two classes of stock is Alphabet, the parent company of Google, which trades as both GOOGL and GOOG.
VTI: Vanguard total stock market ETF
- Assets: $329.5 billion
- Holdings: 3,761 stocks
- Dividend yield: 1.39%
- Expense ratio: 0.03%
Vanguard's Total Stock Market ETF (VTI) is similar to VOO in many ways, but the main difference is that it holds a much broader range of stocks.
It follows the CRSP U.S. Total Market Index, which includes all the stocks in the S&P 500 plus over 3,000 additional stocks. This represents the entire U.S. stock market.
Unlike ETFs that follow the S&P 500, VTI also holds many mid-cap and small-cap stocks.
For this reason, VTI is considered to provide broader exposure to the U.S. stock market and is more diversified. However, because it is weighted by market cap, the biggest U.S. companies also constitute a very large percentage of the ETF's holdings.
Although VTI has over 3,000 more stocks than VOO, these are only a small percentage of the fund's holdings because their market caps are so small.
VOO vs. VTI: key differences
This is a summary of the key differences between VOO and VTI:
| VOO | VTI | |
| Index | S&P 500 | CRSP U.S. Total Market |
| Assets | $355.10 billion | $329.50 billion |
| Stocks | 505 | 3,761 |
| Dividend yield | 1.43% | 1.39% |
| Expense ratio | 0.03% | 0.03% |
Both ETFs have the same top 10 stock holdings:
- Apple (AAPL)
- Microsoft (MSFT)
- Amazon (AMZN)
- NVIDIA (NVDA)
- Alphabet (GOOGL)
- Facebook (META)
- Alphabet (GOOG)
- Tesla (TSLA)
- Berkshire Hathaway (BRK.B)
- UnitedHealth (UNH)
For VOO, the top 10 stocks amount to 31.53% of the ETF's holdings. For VTI, the same top 10 stocks amount to 27.24% of the holdings.
So, even though VTI is more diversified than VOO with exposure to mid-caps and small-caps, the biggest companies are still responsible for most of the returns.
VOO vs. VTI: performance
The biggest holdings are the same for VOO and VTI, so their performance in the past has been similar but not identical.
Here is the average annual performance for the two ETFs as of January, 2024:
| VOO | VTI | |
| 1 Year | 26.33% | 26.11% |
| 3 Year | 9.97% | 8.44% |
| 5 Years | 15.66% | 15.09% |
| 10 Years | 12.00% | 11.44% |
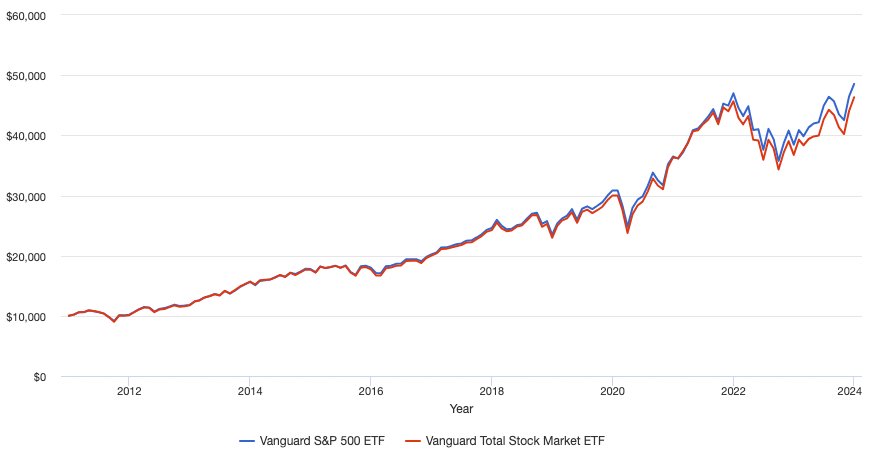
It is clear that VOO has had slightly better returns than VTI in the past few years, but the difference is so small that it is almost negligible.
For example, here's a chart that compares their performance from January 2011 to December 2023:

Source: portfoliovisualizer.com
VOO has not only had slightly better returns, but it has also been somewhat less volatile.
This makes sense since mid-cap and small-cap stocks tend to be more volatile than large-cap stocks. They often go down significantly during market corrections.
Which ETF is the better investment?
In the past few years, VOO has had better investment returns and greater price stability than VTI.
Based on that, VOO has historically been a better investment than VTI. However, past performance is no guarantee that the same will continue to occur in the future.
For this reason, it is impossible to say with any certainty which one will be the better investment moving forward.
VOO has had slightly better returns in the past, but VTI is more diversified and provides broader exposure to the U.S. stock market.
The chances are high that the returns of these two ETFs will continue to be very similar in the future. Both have the same expense ratio and similar dividend yield, so you should choose whichever one you prefer based on the fund's strategy.
If you only want to own the biggest and safest companies, choose VOO. If you want broader exposure and more diversification, choose VTI.
Or, you could also invest in both, for example, by putting half in VOO and half in VTI.
Here's a summary of which one to choose:
- If you want to own only the biggest and safest stocks, choose VOO.
- If you want more diversification and exposure to mid-caps and small-caps, choose VTI.
- If you can't decide, consider simply buying both of them (assuming that commissions are low or free).
However, keep in mind that both ETFs can be highly volatile as they are 100% invested in stocks. Sometimes they may go down 50% or even more, although long-term returns have historically always been good.


