General Mills, Inc. (BMV:GIS)
 Mexico · Delayed Price · Currency is MXN
 | Market Cap | 328.20B -49.5% |
| Revenue (ttm) | 315.26B -6.5% |
| Net Income | 37.82B -13.5% |
| EPS | 69.86 -10.4% |
| Shares Out | n/a |
| PE Ratio | 8.68 |
| Forward PE | 10.33 |
| Dividend | 44.14 (7.18%) |
| Ex-Dividend Date | Apr 10, 2026 |
| Volume | 65 |
| Average Volume | 4,983 |
| Open | 630.00 |
| Previous Close | 624.38 |
| Day's Range | 614.45 - 630.00 |
| 52-Week Range | 614.45 - 1,180.00 |
| Beta | n/a |
| RSI | 28.29 |
| Earnings Date | Mar 18, 2026 |
About General Mills
General Mills, Inc. manufactures and markets branded consumer foods in the United States and internationally. The company operates through four segments: North America Retail; International; North America Pet; and North America Foodservice. It offers grain, ready-to-eat cereals, refrigerated yogurt, soup, meal kits, refrigerated and frozen dough products, dessert and baking mixes, bakery flour, frozen pizza and pizza snacks, snack bars, fruit and savory snacks, ice cream and frozen desserts, unbaked and fully baked frozen dough products, frozen... [Read more]
Financial Performance
In fiscal year 2025, General Mills's revenue was $19.49 billion, a decrease of -1.87% compared to the previous year's $19.86 billion. Earnings were $2.28 billion, a decrease of -8.49%.
Financial numbers in USD Financial StatementsNews

3 Dividend Stocks With Robust Yields For Tough Times
With the S&P 500 Index in red numbers this year, income-minded investors turn their lonely eyes to a sure thing – high-paying dividend stocks.

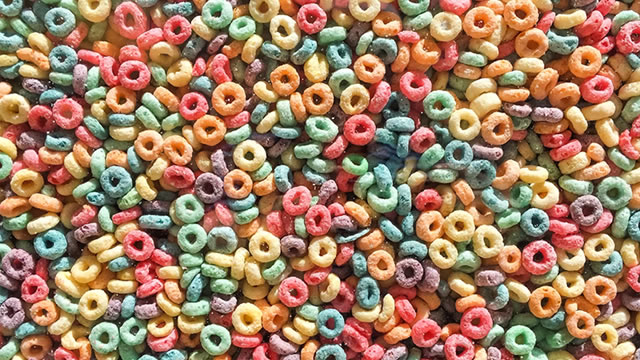
Lucky Charms and Trix Bring Bold Flavors to the Breakfast Table Through New Cereals Made with Colors from Natural Sources
MINNEAPOLIS--(BUSINESS WIRE)--Lucky Charms and Trix are adding more fun and imagination to the cereal aisle with two new cereals made with colors from natural sources. This summer, fans can enjoy Luck...
General Mills Analysts Cut Their Forecasts After Q3 Results
General Mills, Inc. (NYSE: GIS) on Wednesday posted weaker-than-expected quarterly earnings despite slightly topping revenue estimates.

General Mills Posts Lower Profit, Sales Amid Turnaround
General Mills logged lower profit and sales in its fiscal third quarter but said it is nearing an inflection point, thanks to the work the company has done to improve volumes and gain market share.
General Mills Reaffirms Continued Sales Slump After Earnings Miss. Stock Falls.
The cereal maker says it expects adjusted operating profit and net sales to fall in fiscal 2026.
General Mills reaffirms full-year sales, profit forecasts
General Mills reaffirmed its annual sales and profit forecast on Wednesday after slashing it last month, as pressure on consumer spending and stiff competition muted demand for the Cheerios ma...

General Mills Reports Fiscal 2026 Third-quarter Results and Reaffirms Full-year Outlook
MINNEAPOLIS--(BUSINESS WIRE)--General Mills, Inc. (NYSE: GIS) today reported results for its third quarter ended February 22, 2026. “We're reaffirming our fiscal 2026 guidance today, as our focus on e...

How To Earn $500 A Month From General Mills Stock Ahead Of Q3 Earnings
General Mills, Inc. (NYSE: GIS) will release earnings for its third quarter before the opening bell on Wednesday, March 18.

General Mills to Sell its Business in Brazil
MINNEAPOLIS--(BUSINESS WIRE)--General Mills, Inc. (NYSE: GIS) today announced it has entered into a definitive agreement to sell its business in Brazil to 3corações. The proposed transaction, which in...

Top 3 Defensive Stocks Which Could Rescue Your Portfolio In Q1
The most oversold stocks in the consumer staples sector presents an opportunity to buy into undervalued companies.

General Mills Reintroduces Beloved La Tiara Brand
MINNEAPOLIS--(BUSINESS WIRE)--General Mills revives La Tiara taco shell brand, creating over 100 local jobs and expanding from regional to national availability for the first time.

General Mills Brings the Whole Family Together with New The Super Mario Galaxy Movie Themed Foods
MINNEAPOLIS--(BUSINESS WIRE)--General Mills is inviting families to bring the cosmic fun of Nintendo and Illumination's The Super Mario Galaxy Movie home with new foods. Just in time for the film's gl...

General Mills Names Jonathan Ness Chief Supply Chain Officer
MINNEAPOLIS--(BUSINESS WIRE)--General Mills today announced Jonathan Ness has been named Chief Supply Chain Officer, effective March 16, 2026.

All General Mills K-12 School Foods Now Made without Certified Colors
MINNEAPOLIS--(BUSINESS WIRE)--All General Mills K-12 School Foods Now Made without Certified Colors; Underscores company's leadership.

General Mills to Webcast Fiscal 2026 Third Quarter Earnings Results on March 18, 2026
MINNEAPOLIS--(BUSINESS WIRE)--General Mills, Inc. (NYSE: GIS) plans to report results for its fiscal 2026 third quarter on March 18, 2026. A press release, pre-recorded management remarks and supporti...

General Mills Outlook Clouded By Soft Consumer Spending, Pet Segment Struggles, Analysts Say
Wall Street sentiment toward General Mills Inc. (NYSE: GIS) is becoming cautious. A leading analyst has downgraded the stock, reduced his price target and extended the expected recovery timeline.
The K-Shaped Economy Is Testing Stocks Like Walmart and General Mills
Spending differences between high and low-income households are testing seemingly safe consumer staple stocks. WSJ's Aaron Back explains the movement in the sector.
Food Stocks Tumble After General Mills Cuts Sales Forecast
The company lowered its sales outlook because of weaker-than-expected consumer demand.

Cheerios Parent General Mills Slashes Sales Outlook. Its Stock Is Plunging.
General Mills hasn't been eating its Wheaties.

General Mills Cuts Outlook Due to Weak Consumer Sentiment
General Mills lowered its sales and profit outlook for the fiscal year, as stressed consumers are buying fewer snacks and looking for more promotions.
General Mills cut its sales outlook to mark the fifth birthday of its ‘growth' strategy
General Mills's stock was set to fall after the full-year profit and sales outlook were lowered, as the consumer recovery has been slower and has cost more than expected.

General Mills cuts annual sales and profit forecast
General Mills on Tuesday cut its annual core net sales and profit forecasts, blaming weaker consumer sentiment. The company expects annual sales to down 1.5% to 2%, compared to a previous range of dow...

General Mills Outlines Progress on Accelerate Strategy at CAGNY Conference
MINNEAPOLIS--(BUSINESS WIRE)--General Mills, Inc. (NYSE: GIS) will share an update on the company's Accelerate strategy and key initiatives at today's Consumer Analyst Group of New York (CAGNY) Confer...

General Mills Recognized on Newsweek's America's Most Responsible Companies 2026 List
MINNEAPOLIS--(BUSINESS WIRE)--General Mills on Newsweek's America's Most Responsible Companies List for seventh consecutive year, ranked No. 2 in Retail & Consumer Goods industry.

General Mills to Webcast Presentation at CAGNY Conference on Feb. 17, 2026
MINNEAPOLIS--(BUSINESS WIRE)--General Mills, Inc. (NYSE: GIS) announced today that Chairman and Chief Executive Officer Jeff Harmening, Chief Financial Officer Kofi Bruce, and Group President of North...