Tyson Foods, Inc. (BMV:TSN)
 Mexico · Delayed Price · Currency is MXN
 | Market Cap | 399.34B -9.4% |
| Revenue (ttm) | 987.47B +2.8% |
| Net Income | 3.58B -81.0% |
| EPS | 10.02 -81.1% |
| Shares Out | n/a |
| PE Ratio | 111.48 |
| Forward PE | 15.89 |
| Dividend | 37.13 (3.20%) |
| Ex-Dividend Date | Feb 27, 2026 |
| Volume | 5 |
| Average Volume | 30 |
| Open | 1,160.00 |
| Previous Close | n/a |
| Day's Range | 1,160.00 - 1,160.00 |
| 52-Week Range | 940.00 - 1,176.00 |
| Beta | n/a |
| RSI | 66.18 |
| Earnings Date | May 4, 2026 |
About Tyson Foods
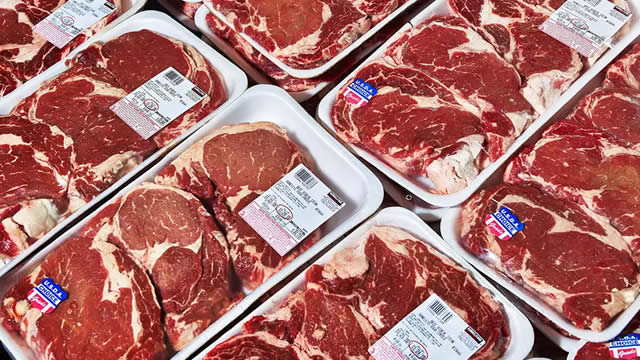
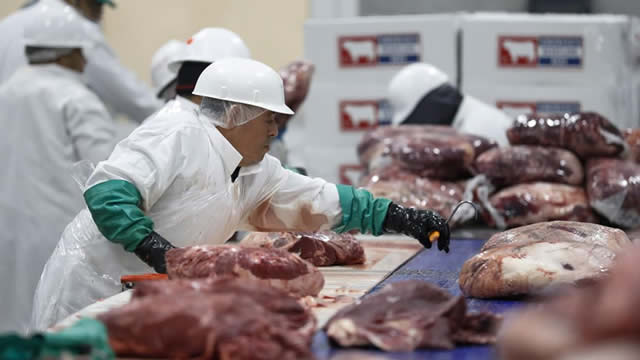
Tyson Foods, Inc., together with its subsidiaries, operates as a food company worldwide. It operates through four segments: Beef, Pork, Chicken, and Prepared Foods. The company processes live fed cattle and hogs; fabricates dressed beef and pork carcasses into primal and sub-primal meat cuts, as well as case ready beef and pork, and fully cooked meats; raises and processes chickens into fresh, frozen, and value-added chicken products, including breaded chicken strips, nuggets, patties, and other ready-to-fix or fully cooked chicken parts; and s... [Read more]
Financial Performance
In fiscal year 2025, Tyson Foods's revenue was $54.44 billion, an increase of 2.12% compared to the previous year's $53.31 billion. Earnings were $474.00 million, a decrease of -40.75%.
Financial numbers in USD Financial StatementsNews

Tyson Foods Announces Second Quarter Earnings Conference Call and Webcast
SPRINGDALE, Ark., April 08, 2026 (GLOBE NEWSWIRE) -- Tyson Foods, Inc. (NYSE: TSN) will release second quarter 2026 financial results on Monday, May 4, 2026. Management will host a conference call and...

North Texas Food Bank Invites Community to “Taste! At The Star” to Support Children Facing Hunger
Annual culinary fundraiser returns April 17 at the Ford Center at The Star in Frisco Annual culinary fundraiser returns April 17 at the Ford Center at The Star in Frisco

Jimmy Dean® Protein Lineup Expands with New Bowls Featuring 40 Grams of Protein
SPRINGDALE, Ark., March 16, 2026 (GLOBE NEWSWIRE) -- As consumers increasingly prioritize protein, the Jimmy Dean ® brand is introducing a new lineup of high protein options that deliver up to 40 gram...

Tyson Foods Strengthens Razorback Partnership with Landmark Athletics Sponsorship of All Varsity Sports
SPRINGDALE, Ark., March 04, 2026 (GLOBE NEWSWIRE) -- Tyson Foods and the University of Arkansas Department of Intercollegiate Athletics announced today an expanded partnership, introducing one of the ...

Tyson Foods, Inc. Announces Pricing of Senior Notes Offering
SPRINGDALE, Ark., Feb. 10, 2026 (GLOBE NEWSWIRE) -- Tyson Foods, Inc. (the “Company” or “we”) (NYSE: TSN) announced today that it has agreed to sell $500 million aggregate principal amount of its 4.95...

Tyson Foods Announces Quarterly Dividend
SPRINGDALE, Ark., Feb. 04, 2026 (GLOBE NEWSWIRE) -- The Board of Directors of Tyson Foods (NYSE: TSN), at a meeting on February 4, 2026, declared a quarterly dividend of $0.51 per share on Class A com...
Tyson Foods Tops Earnings Estimates on Strong Chicken Sales. The Stock Is Falling.
The meat processor beats earnings and revenue estimates for its fiscal first quarter.
Tyson Foods beats quarterly profit estimates on chicken demand
U.S. meatpacker Tyson Foods reported higher-than-expected quarterly earnings on Monday, as increased demand for its chicken products overshadowed hefty losses in its beef business.

Tyson Foods Reports First Quarter 2026 Results
SPRINGDALE, Ark., Feb. 02, 2026 (GLOBE NEWSWIRE) -- Tyson Foods, Inc. (NYSE: TSN), one of the world's largest food companies and a recognized leader in protein with leading brands including Tyson, Jim...

NFM Announces Leadership Transition: Bob Tyson Appointed CEO, LaTasha Waddy Named President
NFM Lending is pleased to announce a strategic leadership transition. Bob Tyson has moved from President to Chief Executive Officer. Chief Legal Counsel and SVP LaTasha Waddy has been named President ...

Tyson Foods to Hold Annual Meeting of Shareholders
SPRINGDALE, Ark., Jan. 12, 2026 (GLOBE NEWSWIRE) -- Tyson Foods, Inc. (NYSE: TSN) will hold its Annual Meeting of Shareholders on Thursday, February 5, 2026 at 11:00 a.m. Eastern time (10 a.m. Central...

RFK Jr's Food Pyramid Could Mean Family Grocery Bills Of $36,400 A Year: Stocks Poised To Win Or Lose
New food guidelines shared by Health and Human Services Secretary Robert F. Kennedy Jr. this week have consumers, health experts and food companies taking note.

Tyson Foods Announces First Quarter Earnings Conference Call and Webcast
SPRINGDALE, Ark., Jan. 05, 2026 (GLOBE NEWSWIRE) -- Tyson Foods, Inc. (NYSE: TSN) will release first quarter 2026 financial results on Monday, February 2, 2026. Management will host a conference call ...

Tyson Foods to close major beef plant, scale back operations as cattle supplies decline
Tyson Foods will close its Nebraska beef plant affecting 3,200 workers and scale back Texas operations as cattle shortages force major industry restructuring.
Tyson to Close One of the Biggest Beef-Processing Plants in the U.S.
The largest meat supplier in the U.S. has lost more than $425 million on beef this year, despite near record-high prices.

Tyson Foods will stop calling its beef ‘net zero' and ‘climate smart' after lawsuit from environmental group
Tyson Foods has agreed to stop making claims about reaching “net zero” or selling “climate-smart” beef for at least five years, part of a settlement from a lawsuit brought against it by the nonprofit ...
Tyson Foods to halt carbon emissions claims, environmental group says
Tyson Foods has agreed to stop saying it will reach net-zero greenhouse gas emissions by 2050 and marketing beef as climate friendly to settle a lawsuit that accused the U.S. meat company of misleadin...

The Score: Tyson, Robinhood, Walmart, Paramount Skydance and More Stocks That Defined the Week
Here are some of the major companies whose stocks moved on the week's news.

McDonald's, Tyson and other companies have gotten more anxious about the fallout from SNAP delays
One analyst says payment delays across states are likely, even after the government's reopening.
How Tyson's Chicken Business Will Offset Beef Weakness
Tyson Foods, Inc. (NYSE:TSN) shares traded higher on Tuesday after the company released its fourth-quarter and fiscal 2025 results on November 10.
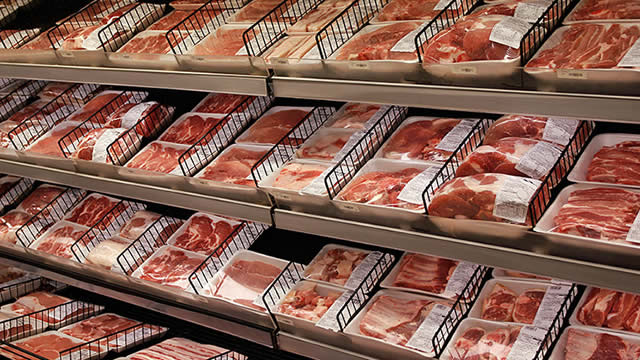
Tyson Warns Of Plummeting Consumer Beef Purchases—As Chicken Sales Soar
Shares of Tyson Foods rose modestly Monday after the company posted mixed results in its fourth quarter and reported chicken sales have reached a three-year high amid a drop in demand for beef as pric...

Chicken sales are booming as people move away from high-priced beef, Tyson Foods says
Chicken sales reached a three-year high, and demand is expected to remain strong in 2026 while beef pressures continue.
Cramer's Stop Trading: Tyson Foods
Jim Cramer breaks down why he's keeping an eye on shares of Tyson Foods.

S&P 500 Surges 1%; Tyson Foods Posts Upbeat Earnings
Tyson Foods, Inc. (NYSE:TSN) reported better-than-expected fourth-quarter earnings.
Tyson Foods Misses Sales Estimates. Why the Stock Is Rising Anyway.
The meat supplier faces falling beef and pork volumes, but chicken sales are bucking the trend.