Exxon Mobil Corporation (BMV:XOM)
 Mexico · Delayed Price · Currency is MXN
 | Market Cap | 10.95T +6.2% |
| Revenue (ttm) | 5.83T -4.5% |
| Net Income | 519.28B -14.4% |
| EPS | 120.62 -14.5% |
| Shares Out | n/a |
| PE Ratio | 21.09 |
| Forward PE | 16.26 |
| Dividend | 74.36 (2.82%) |
| Ex-Dividend Date | Feb 12, 2026 |
| Volume | 480 |
| Average Volume | 4,236 |
| Open | 2,660.00 |
| Previous Close | 2,697.00 |
| Day's Range | 2,635.01 - 2,660.00 |
| 52-Week Range | 1,953.10 - 3,199.99 |
| Beta | 0.29 |
| RSI | 40.05 |
| Earnings Date | May 1, 2026 |
About Exxon Mobil
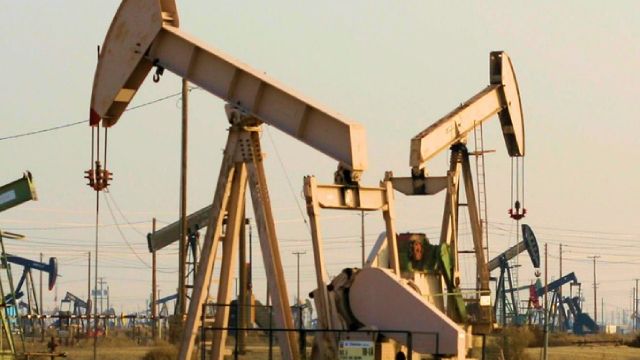
Exxon Mobil Corporation engages in the exploration and production of crude oil and natural gas in the United States, Canada, and internationally. The company operates through Upstream, Energy Products, Chemical Products, and Specialty Products segments. Its Upstream segment explores for and produces crude oil and natural gas. The Energy Products segment offers fuels, aromatics, and catalysts, as well as licensing services. Its Chemical Products segment manufactures and sells olefins, polyolefins, and intermediates. The Specialty Products segmen... [Read more]
Financial Performance
In 2025, Exxon Mobil's revenue was $323.91 billion, a decrease of -4.52% compared to the previous year's $339.25 billion. Earnings were $28.84 billion, a decrease of -14.36%.
Financial numbers in USD Financial StatementsNews

Exxon plans spring and year-end overhauls at Beaumont, Texas refinery, sources say
Exxon Mobil Corp plans overhauls in the spring and at the end of this year at its 612,000 barrel-per-day Beaumont, Texas refinery, said people familiar with plant operations.


ExxonMobil, Shell Report Big Hits From Iran Conflict
ExxonMobil CEO Darren Woods famously deemed Venezuela's energy sector to be “uninvestible” in his company's view during a White House meeting on January 9. On Monday, J.P.
Exxon and Shell reveal production hit from Iran war
Integrated oil majors Exxon Mobil and Shell each revealed how the Iran war hurt production in the first quarter.

Exxon signals Q1 upstream profit bump from Iran war, downstream boost in later quarters
Higher oil and gas prices due to the U.S.-Israeli war on Iran could boost Exxon Mobil's first-quarter upstream earnings by up to $2.9 billion, outweighing the impact of disruptions to some of its oil...
Exxon, Chevron, More Oil Stocks Fall. Get Used To It.
The stock market may be set for a bumper rally Wednesday but it's going to be a tough day for the energy sector.

Microsoft Is Now The Biggest Deadweight On S&P 500 — And Exxon Is What Nvidia Used To Be
Other mega‑cap growth darlings aren't far behind on the losers list — in fact, the Magnificent 7 round out the top 7 detractors:

Why Oil Prices Just Soared 70% Despite A U.S. Supply Glut. Here Are The Surprise Winners And Losers
The U.S. produces more energy than it consumes. Yet the price of oil has soared about 70% since Feb. 28 when the U.S. and Israel attacked Iran, according to LiteFinance.

Oil Stocks Look Tapped Out. Why It's Time to Move Into Other Sectors.
Oil popped 8% Thursday, but oil company stocks gained just 0.5%. It suggests the stocks already reflect most of the higher crude prices.

Energy Dominated Q1 2026 As The Broader Market Stumbled
The first quarter of 2026 marked a sharp shift from the broad-based strength that closed out last year. The S&P 500 finished in negative territory as investors wrestled with a new war in the Middle Ea...

Exclusive: Italy to get LNG from QatarEnergy-Exxon's US Golden Pass from June, sources say
Italy will begin receiving liquefied natural gas (LNG) from the Golden Pass LNG facility in the United States, a joint venture between QatarEnergy and Exxon Mobil , from June, two sources familiar w...

Exxon Just Overtook Nvidia — In A Twist Unthinkable Three Months Ago
Benzinga Pro data suggests their respective forward P/E ratios stand at 22.3x vs 21.4x (as on April 1)— flipping one of the market's most dominant narratives: that AI commands the richest valuations.
ExxonMobil stock slips as oil falls, but rally may not be over yet
Shares of ExxonMobil declined on Wednesday, tracking a pullback in crude prices as investor optimism grew that the conflict between the United States and Iran could ease in the coming weeks. Despite t...

Exxon, Chevron, and More Oil Stocks Fall. Why That Could Be the New Normal.
Investors may have to get used to selloffs in oil stocks, given that the market is betting that the Iran war could end soon.


Exxon Scientists Had Doubts About Algae Biofuels. The Oil Giant Touted Them Anyway.
The company's scientists didn't agree with the way the project was presented to investors.
Union workers ratify contract at Exxon Louisiana complex, sources say
Union workers at Exxon Mobil's refining and chemical plant complex in Baton Rouge, Louisiana, ratified a new four-year contract on Friday, sources familiar with plant operations said.

Exxon and QatarEnergy's joint venture Golden Pass produces first LNG at new Texas facility
Golden Pass LNG, a joint venture between QatarEnergy (QATPE.UL) and Exxon Mobil , has produced its first liquefied natural gas at its new facility in Texas, the company said on Monday, marking a majo...

CERAWEEK Oil, gas exploration is back: Energy giants hunt to replenish reserves
Global energy companies are getting back to basics and focusing on the hunt for new sources of oil and gas, executives declared at the CERAWeek conference in Houston this week, ending years of underin...

3 Dividend Stocks With Robust Yields For Tough Times
With the S&P 500 Index in red numbers this year, income-minded investors turn their lonely eyes to a sure thing – high-paying dividend stocks.


These 3 US stocks are 'must own' as Iran war reignites inflation debate
The US-Iran war has sent shockwaves far beyond the “Strait of Hormuz”, landing squarely on Wall Street. As the conflict continues, the global economy faces a dual-threat environment: rising energy cos...

Producers Are Looking Far Afield for Oil. It's ‘An Old-Fashioned Land Grab.
The war and peaking U.S. shale is leading oil companies to look for opportunities abroad.

Move Over Exxon—This $5 Billion Stock Just Became Wall Street's Hottest Iran Trade
Chart created using Benzinga Pro