Delta Air Lines, Inc. (ETR:OYC)
 Germany · Delayed Price · Currency is EUR
 | Market Cap | 36.55B +40.9% |
| Revenue (ttm) | 53.97B +2.8% |
| Net Income | 4.26B +44.8% |
| EPS | 6.52 +43.7% |
| Shares Out | n/a |
| PE Ratio | 8.58 |
| Forward PE | 9.54 |
| Dividend | 0.66 (1.15%) |
| Ex-Dividend Date | Feb 26, 2026 |
| Volume | 484 |
| Average Volume | 355 |
| Open | 57.67 |
| Previous Close | 58.35 |
| Day's Range | 56.95 - 57.67 |
| 52-Week Range | 48.05 - 63.33 |
| Beta | n/a |
| RSI | 54.12 |
| Earnings Date | Apr 8, 2026 |
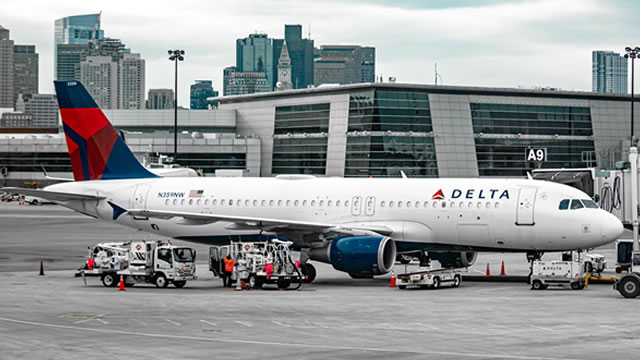
About Delta Air Lines
Delta Air Lines, Inc. provides scheduled air transportation for passengers and cargo in the United States and internationally. The company operates through two segments, Airline and Refinery. Its domestic network centered on core hubs in Atlanta, Detroit, Minneapolis-St. Paul, and Salt Lake City, as well as coastal hub positions in Boston, Los Angeles, New York-LaGuardia, New York-JFK, and Seattle; and international network centered on hubs and market presence in Amsterdam, Bogota, Lima, Mexico City, London-Heathrow, Paris-Charles de Gaulle, Sa... [Read more]
Financial Performance
In 2025, Delta Air Lines's revenue was $63.36 billion, an increase of 2.79% compared to the previous year's $61.64 billion. Earnings were $5.01 billion, an increase of 44.78%.
Financial numbers in USD Financial StatementsNews
Focus: Delta Air Lines' refinery bet looks more valuable in jet fuel squeeze
When Delta Air Lines bought an aging refinery outside Philadelphia in 2012, the move looked unusual.

Delta Air Lines temporarily halts perks for members of Congress, citing the partial government shutdown
Delta halted special services for Congress, including perks that get them through security faster. Delta cited the "impact on resources from the longstanding government shutdown" for its decision.
Delta suspends 'specialty services' perk for members of Congress, cites DHS shutdown
Delta Air Lines suspended its airport escorts and red coat services for Congress members and their staff, citing the partial shutdown of the Department of Homeland Security. The move comes a week afte...
Delta suspends special service perk for Congress members amid DHS funding battle
Airline CEOs have urged Congress to restore funding to the TSA as lengthy security lines plague US airports
Delta suspends special treatment for Congress as shutdown sows chaos in airports
Delta Air Lines cited the impact of a partial government shutdown that has disrupted U.S. air travel.
United ditches more economy seats to make room for bigger premium cabins with new layouts
United Airlines is adding more first-class and other roomy seats that command a premium over economy options. The carrier is introducing new cabins on some of its regional jets and rolling out a subfl...
Travel feels scary and chaotic right now—but Delta, American, and United airlines stocks are soaring today. Here's why
Air travel is currently in a state of chaos. TSA agents are calling out of their jobs en masse; security lines are piling up; extreme weather is delaying flights; and on March 23, President Trump depl...

Travel stocks are among the biggest gainers as Trump teases Iran talks
Travel-related stocks such as airlines and cruise companies rallied Monday after President Donald Trump postponed his deadline for more strikes in Iran, saying the two countries had held “very good an...
Your Next Flight Could Cost More, Offer Less — And Iran War Is Part Of The Reason
Carriers such as Delta Air Lines, Inc (NYSE:DAL), United Airlines Holdings, Inc. (NASDAQ:UAL) and Southwest Airlines Co. (NYSE:LUV) are already responding by raising fares, adding surcharges and cutti...

Delta Air Lines Announces Webcast of March Quarter 2026 Financial Results
ATLANTA, March 19, 2026 /PRNewswire/ -- Delta Air Lines (NYSE:DAL) will hold a live conference call and webcast to discuss its March quarter 2026 financial results at 10 a.m. ET, Wednesday, April 8, 2...
Delta CEO blasts Congress over unpaid TSA agents as airport chaos continues: ‘We're outraged'
“It's inexcusable that our security agents, our frontline agents, that are essential to what we do, are not being paid, and it's ridiculous to see them being used as political chips,” Bastian told CNB...
Tuesday's Final Takeaways: Airline Stocks Take Flight & FOMC Meeting Begins
Sam Vadas explains why airline stocks like Delta (DAL) and American Airlines (AAL) took off on today's session and previews Wednesday's interest rate decision from the Fed. ======== Schwab Network ===...
DAL Soars on Guidance, Can Shares Fly Higher?
Tim Biggam looks at the chart of Delta Airlines (DAL), offering a bull put spread example options trade. “I would not be chasing Delta, or really any stocks here,” he notes amid market volatility.
Delta Stock Jumps as 'Really Great' Travel Demand Offsets Surging Fuel Prices
Delta Air Lines CEO Ed Bastian says demand "has been really, really great," offsetting the impact of a surge in oil prices since the start of the Iran war.
American And Delta Airlines Say High Demand Outweighs Fuel Cost Impact
Fuel prices have risen, but demand for airline seats has risen faster, the CEOS of both American Airlines and Delta Airlines said Tuesday morning.
Tuesday's Morning Movers: DAL Lifts Guidance, LLY & DKNG Downgrades
Delta Airlines (DAL) upped its revenue guidance to high single-digit growth, giving a much-needed boost to shares after airlines took a hit over Iran uncertainty. HSBC shed bullish optimism in Eli Lil...
Delta Air Lines, Inc. (DAL) Presents at JPMorgan Industrials Conference 2026 Transcript
Delta Air Lines, Inc. (DAL) Presents at JPMorgan Industrials Conference 2026 Transcript
Airlines See Surge in Demand as Fuel Prices Rise
Airlines are seeing a surge in demand as customers try to lock in their tickets ahead of a likely surge in prices due to fuel costs brought on by the war in the Middle East. Delta and American Airline...
Delta CEO on demand: 'We've seen eight of the top 10 sales days in our history this quarter'
Delta CEO Ed Bastian told CNBC's Phil LeBeau that Delta had taken a $400 million hit so far for the fourth quarter, but that demand has been "really, really great," which was leading to higher revenue...
Delta Air Lines CEO Ed Bastian on state of travel, rising jet fuel costs and TSA staffing shortage
CNBC's Phil LeBeau and Delta Air Lines CEO Ed Bastian join 'Squawk Box' to discuss the state of travel demand, company guidance, impact of higher jet fuel prices, DHS funding, TSA staffing shortages, ...
Airline stocks rise as Delta, JetBlue signal strong demand despite oil spike
Airline stocks climbed on Tuesday after major US carriers signalled that robust travel demand is helping cushion the impact of soaring fuel costs triggered by the escalating Middle East conflict, offe...
Delta defies oil-price spike and boosts its revenue outlook as travel demand accelerates
Delta soothes investor fears over the effect of rising oil prices by raising revenue guidance, and the stock surges.
Delta Lifts Revenue Guidance for First Quarter, Maintains Capacity Flexibility
Delta Air Lines is looking to maintain capacity flexibility to weather the threat of fuel prices remaining elevated.
Delta Stock Is Surging. Why It's a Pivotal Day for Airlines.
United Airlines, Southwest, Delta and American have fallen sharply since the Iran war started.