Price-to-Earnings Ratio (PE Ratio)
 Written by Kris Gunnars, BSc
The price-to-earnings (PE) ratio is the ratio between a company's stock price and earnings per share. It measures the price of a stock relative to its profits.
You calculate the PE ratio by dividing the stock price with earnings per share (EPS).
Formula: PE Ratio = Price Per Share / Earnings Per Share
Generally speaking, a low PE ratio indicates that a stock is cheap, while a high ratio suggests that a stock is expensive.
However, the PE ratio can also indicate how much investors expect earnings to grow in the future. The higher the ratio, the better the growth prospects.
The PE ratio is often referred to as the "earnings multiple" or simply "the multiple." You can write it as either PE or P/E.
A simple way to think about the PE ratio is how much you are paying for one dollar of earnings per year. A ratio of 10 indicates that you are willing to pay $10 for $1 of earnings. It effectively gives you an "earnings yield" of 10%.
If earnings remain constant, a PE ratio of 10 means it will take ten years to earn back your initial investment.
The PE ratio is commonly used to value individual stocks, or even entire markets or industries. You can also use it to compare two or more stocks or markets against one another.
Formula: how to calculate the PE ratio
If you know a company's stock price and its earnings per share, then it is very easy to calculate the PE ratio. You simply divide the stock price with the EPS.
Formula: PE Ratio = Stock Price / Earnings Per Share
You can find the stock price and EPS by entering the stock's ticker symbol into the search form of various finance and investing websites.
Another way to calculate the PE ratio is by dividing the company's market cap with its total net income.
Formula: PE Ratio = Market Cap / Net Income
Examples
(Note: The numbers below are for demonstration purposes and may not be up-to-date.)
Microsoft stock (MSFT) was trading at $165 per share and its EPS in the prior 12 months was $5.30.
That means Microsoft's PE ratio was $165 / $5.30 = 31.1. This is a high PE ratio, but it may make sense because of Microsoft's earnings growth rate and promising future prospects.
As another example, General Motors stock (GM) was trading at $34.31 and their EPS in the prior 12 months was $6.14.
This gives General Motors a PE ratio of $34.31 / $6.14 = 5.59. A ratio of 5.59 is low, indicating that the stock is cheap. But it may be justified given the poor outlook for the automobile industry.
For comparison, the S&P500 had a PE ratio of 24.80. This means that Microsoft was valued higher than the market, while General Motors was valued much lower.
It is common for stocks that are growing rapidly to have a high PE ratio. If earnings keep growing, they may eventually "catch up" to the stock price and make the valuation seem reasonable.
Different types of PE ratios
There are several different PE ratios in common use. The difference between them is the denominator, as in which EPS number is used when calculating the ratio.
Trailing PE Ratio (standard)
The standard PE ratio uses the trailing twelve months (TTM) EPS number. This is the combined earnings per share for the last four quarters.
You add up the EPS for the last four quarters to get the trailing EPS number.
When you see EPS or PE ratio for a stock on a finance website, then it is usually the trailing-twelve-month number except if stated otherwise.
The trailing PE ratio can sometimes be inaccurate or misleading if a company has one-time charges that affected its earnings in the prior 12 months.
If you use a company's "adjusted" EPS number to calculate the PE ratio, then this may more accurately reflect the company's true valuation since it removes one-time charges.
Forward PE Ratio
The forward PE ratio uses a future estimate of EPS.
You can find the projected EPS number by adding up the EPS estimates for the next four quarters. Sometimes this ratio is also calculated by using EPS estimates for the next fiscal year.
This ratio tells you what the stock's valuation will be in one year if the stock price doesn't change but still lives up to the EPS estimates.
Given that the forward PE uses estimates, it is not as accurate as the trailing PE, which uses exact numbers.
The forward PE is often much lower than the trailing PE. This may indicate expectations for significant earnings growth in the coming year, or it may be because one-time charges were affecting the trailing PE.
On the other hand, if the forward PE ratio is higher than the trailing PE ratio, then it may suggest that earnings are expected to decline.
The CAPE Ratio (Shiller PE)
The CAPE (Cyclically Adjusted Price-to-Earnings) ratio is also called "PE 10" or "Shiller PE." It is a popular variation of the trailing PE ratio.
It uses the inflation-adjusted moving average EPS over the past ten years to calculate the ratio.
The CAPE ratio is commonly used to measure the valuation of the market as a whole or to compare the valuation of different sectors.
When the CAPE ratio is high, it indicates that stocks are expensive relative to historical norms.
This chart from multpl.com shows how the CAPE ratio has changed over time.
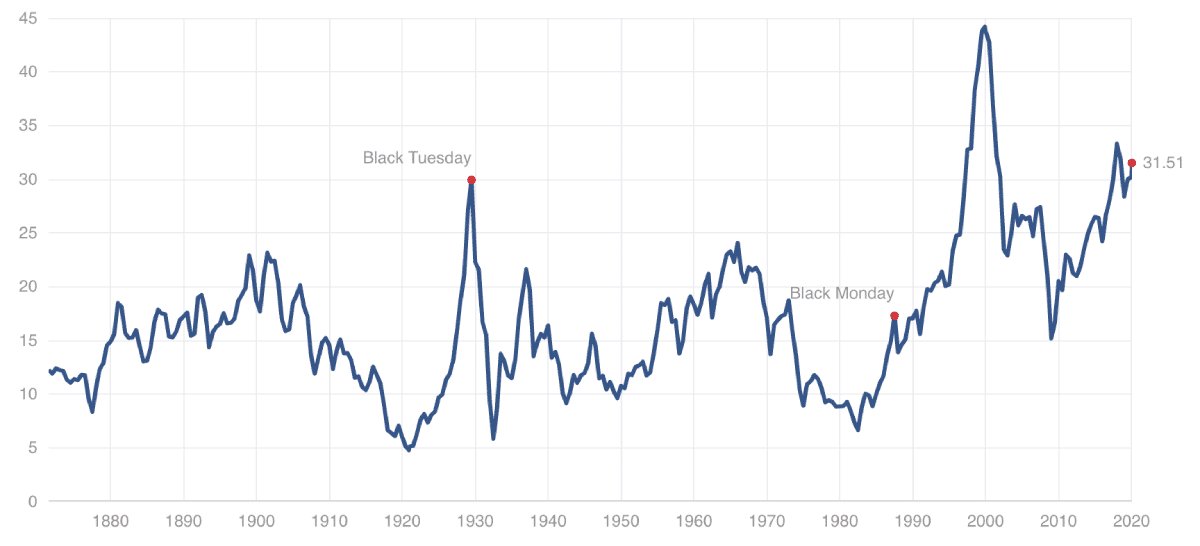
When the CAPE ratio is low, it means that expected future returns from the stock market are likely to be high. But when it is high, the stock market returns in the coming years will likely be low or even negative.
The CAPE ratio tends to be high during long bull markets, but low during the depths of a recession.
What is a good PE ratio?
It is very hard to determine what is a "good" or "bad" PE ratio.
That's because price-to-earnings isn't a good way to value all the different types of stocks.
For example, companies with a high growth potential tend to have a high PE ratio, while companies with slow or even negative growth tend to have a low PE ratio.
The PE ratio can be pretty insightful for value stocks with stable financials, but it's less useful for stocks that are growing fast or declining fast.
That said, here is a general guideline about good PE ratios based on growth rate:
- No growth: 10 or lower
- Slow growth: 12
- Moderate growth: 15
- Fast growth: 25+
However, you should never invest based on the PE ratio alone. There is no single number that can tell you if an investment is a good idea.
The PEG Ratio (Price/Earnings to Growth)
One useful way to check if a stock's PE ratio is reasonable is to also look at a related metric that incorporates the company's earnings growth rate.
This is a valuation metric called the PEG ratio (Price/Earnings to Growth).
If you divide the PE ratio by the company's earnings growth rate, you get the PEG ratio — a number that is much more useful to value stocks that are growing fast.
As an example, a stock with a PE ratio of 20, but is growing earnings at 20% per year, will have a PEG ratio of 1.
A stock with a PEG ratio lower than 1 is cheap relative to its earnings growth, but a number much higher than 1 implies that the stock is expensive.
The PEG ratio can be calculated in different ways. A trailing PEG ratio uses the trailing PE ratio and earnings growth rate, while a forward PEG ratio uses future estimates.
PE ratio of industries, sectors and markets
The PE ratio is often used to compare broad baskets of stocks.
For example, the average PE ratio can be measured across entire stock indexes, markets, sectors, industries, and countries.
Some investors might compare the PE ratio of the US stock market and the European stock market to find out which one might have better investments.
Others may use the PE ratio to compare the valuation of different industries, such as comparing the technology industry to the financial industry.
By looking at average PE ratios, it is possible to get an idea of whether entire sectors, industries, or markets are over- or undervalued.
That said, some types of industries inherently have lower or higher PE ratios than others, mostly because of different growth prospects or business conditions.
Historical PE ratios
Comparing PE ratios to their historical averages can be very telling.
In some cases, big increases in stock prices are primarily caused by an expansion in the PE ratio.
In this way, expanding PE ratios can be a visible sign of a bubble. They indicate that prices are growing much faster than earnings.
For example, if you were considering investing in the US stock market at the height of the dot-com bubble around 1999–2000, you might have noticed a sky-high PE ratio of over 40 and decided to hold off on investing.
Looking at PE ratios and other valuation metrics before investing can help protect you from getting swept up in bubbles, fads, and manias.
PE ratio vs earnings yield
The earnings yield is another valuation metric that is simply the inverse of the P/E ratio (the E/P ratio).
If you turn the formula around and divide the EPS number by the stock price and multiply by 100, then you get the earnings yield percentage.
Formula: Earnings Yield (%) = (EPS / Stock Price) * 100
For example, a company with a stock price of $20 and an EPS of $1 has a PE ratio of 20 ($20 / $1) and an earnings yield of 5% (($1 / $20) * 100).
If you want to compare the "yield" of different investments, then this may be a more useful number than the PE ratio.
For example, you may see that a savings account yields 2%, while a stock you like has an earnings yield of 5% with earnings that are growing each year.
Comparing the yields can give you a good idea of which one is a better long-term investment, although you should keep in mind that stocks are also much riskier than a savings account.
Negative PE ratios
A stock with negative earnings per share also has a negative PE ratio.
Many finance websites (including Stock Analysis) don't show the PE ratio if EPS is negative because a negative PE ratio isn't very informative. Instead, they show n/a, which stands for "not applicable."
Stocks can have losses for many reasons, and it doesn't necessarily mean that they are inherently unprofitable. For example, one-time writedowns and tax charges can sometimes make the EPS and PE ratio negative.
Also, many companies that are growing fast like to reinvest all of their earnings to fuel further growth. These stocks can be great investments, even if the PE ratio is negative.
For example, the PE ratio of Amazon (AMZN) has often been negative or very high, but the company was growing quickly and gaining market share at the same time.
Limitations of the PE Ratio
The PE ratio is very popular because it is easy to understand and easy to calculate.
But it still has significant limitations, so it should not be used in isolation to determine whether a stock is worth buying.
It is essential to consider other valuation metrics and evaluate the company's future growth prospects.
Investing based on the PE ratio alone is a bad idea because cheap stocks are often cheap for a good reason.
On the other hand, some of the best-performing stocks in recent years have had very high PE ratios (such as Amazon).
It's also important to consider that the EPS number itself can be misleading due to complicated accounting methods.
For example, companies that have positive EPS can have negative free cash flow, meaning that they are spending more money than they earn despite being "profitable" based on accounting earnings.
Importantly, there is no single metric that can tell you whether a stock is a good investment or not.
Although the PE ratio is useful to get a quick idea of a company's valuation, it is still just one part of a complicated puzzle.