Free Cash Flow (FCF)
 Written by Kris Gunnars, BSc
Free cash flow (FCF) is the amount of cash a company has generated after spending on everything required to maintain and grow the business. You calculate it by subtracting capital expenditures from operating cash flow.
In many ways, free cash flow is similar to earnings or net income. But it looks at plain cash instead of accounting earnings, which are affected by various non-cash items like write-downs.
Free cash flow can also be seen as the amount of cash a company generates that is available to all its stakeholders, including both shareholders and bondholders.
A stock with strong free cash flows is attractive to stock investors because the company can return the cash to shareholders via dividends and share buybacks.
Many investors prefer looking at free cash flow instead of earnings. Even though it is more volatile than earnings, free cash flow is harder to manipulate.
Free cash flow is a particularly good indicator of whether a company can pay back its debts, or maintain or even grow its dividend payments.
Free cash flow formula
To calculate free cash flow for a stock, you first need to find two numbers: cash flow from operations and capital expenditures.
You can find these on a company's cash flow statement, although capital expenditures are usually listed as "purchases of property and equipment" or something similar.
When you have found the numbers, you simply subtract the capital expenditures from the operating cash flow.
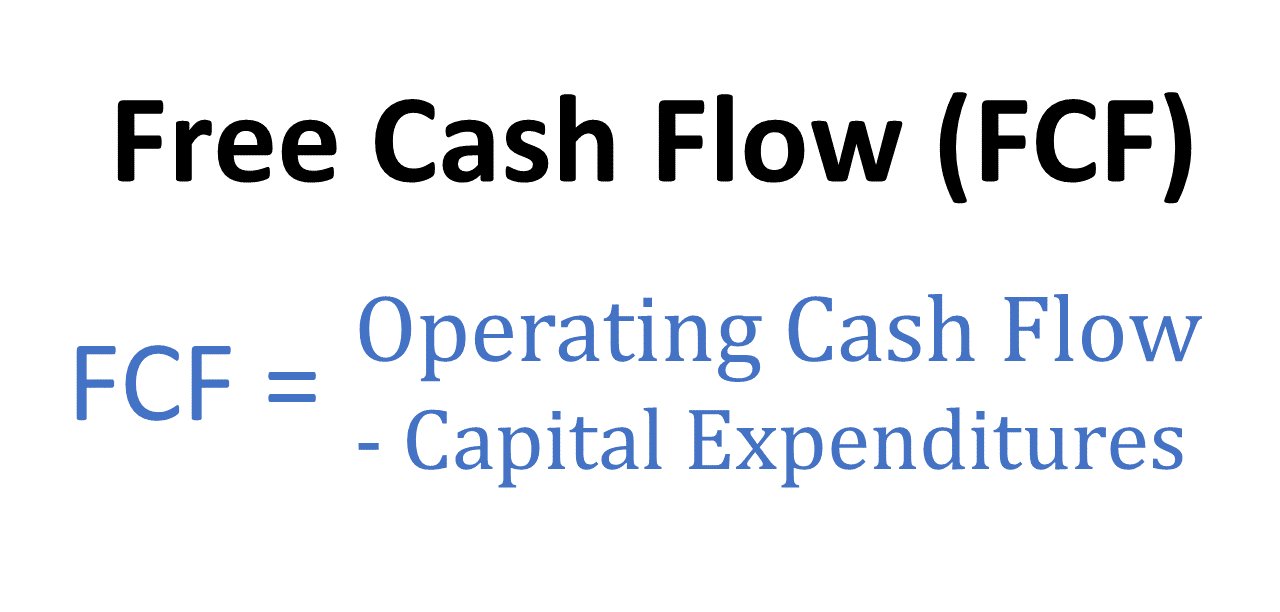
Formula: Free Cash Flow = Operating Cash Flow - Capital Expenditures
The simple formula above is good enough for most investors. But professionals may use more complicated methods that take other factors into account.
Here is another formula sometime used to calculate free cash flow:
Formula: Free Cash Flow = EBIT * (1 - Tax Rate) + Depreciation & Amortization - Changes in Working Capital - Capital Expenditures
If you want to calculate free cash flow per share, then you divide the total FCF number by the total number of shares outstanding.
Formula: FCF per Share = Free Cash Flow / Shares Outstanding
Looking at free cash flow per share along with earnings per share (EPS) is often useful to get an idea of how much a shareholder is getting for each stock.
If FCF per share goes up over time, then the company's ability to make money for its owners is going up.
Unfortunately, not all companies report free cash flow when they report earnings. But it is easy to calculate if you look at the cash flow statement.
What operating cash flow and capital expenditures mean
To understand free cash flow, it is helpful to know what the inputs in the formula mean:
- Operating cash flow (OCF): Usually listed as "Net cash provided by (used in) operating activities." This is the amount of cash a company generates during normal business activities.
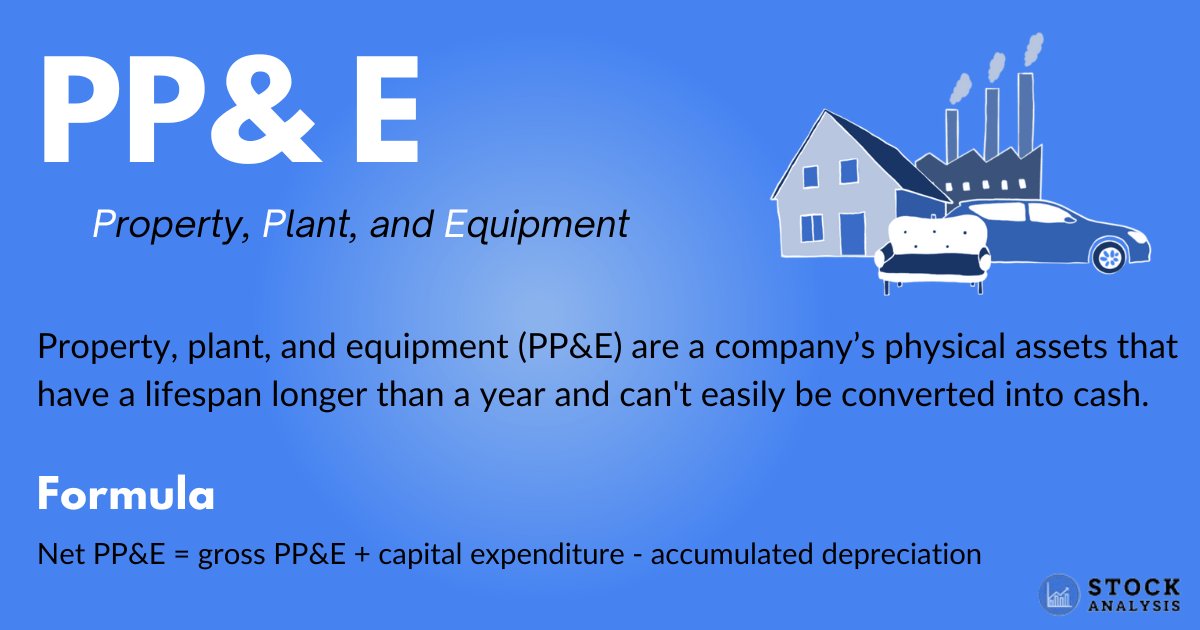
- Capital expenditures (CapEx): Usually listed as "Purchases of property and equipment." This is cash spent on assets that are needed to maintain and grow the business's operations.
As a hypothetical example, let's imagine a car company that generates $100 million in cash during a fiscal year. This is the operating cash flow.
But the company needs to buy a new automobile factory that costs $20 million. This is a capital expenditure, also termed CapEx.
Without the new factory, the company wouldn't be able to continue maintaining and growing its market share.
In this case, the company's free cash flow for the fiscal year is $100 million - $20 million = $80 million.
$80 million is the cash left after the company has spent on everything it needs to maintain and grow the business. It can be used for dividends, share buybacks, or to pay back debts or acquire other companies.
How to calculate free cash flow for a real company
If you want to calculate FCF yourself, then you need to find the operating cash flow and capital expenditures.
You can find these numbers in the cash flow statement of a company's annual report (10K) or quarterly report (10Q).
The best way to find these reports for a U.S. company is typing the stock ticker symbol into the search bar on the SEC's website.
As an example, let's calculate the free cash flow generated by Tesla (TSLA) in 2023.
Here's a screenshot from Tesla's 2023 annual report showing operating cash flow (Net cash provided by operating activities) and capital expenditures (Purchases of property and equipment):
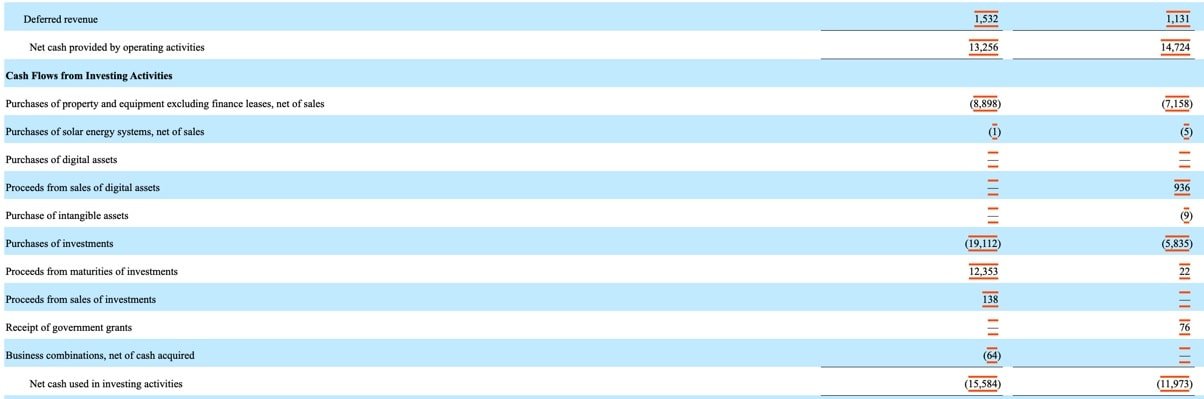
Source: EDGAR
You can see that operating cash flow was $13,256 million and capital expenditures were $8,898 million.
According to this, Tesla's free cash flow for 2023 was: $13,256 - $8,898 = $4,358 million.
Free cash flow vs earnings
Like earnings, free cash flow is a measure of profitability. It tells you how much cash a company has left after paying for all expenses.
However, free cash flow is "cleaner" than earnings because it measures actual cash and is less sensitive to various accounting adjustments that can be misleading.
For example, earnings (or net income) includes various non-cash items like depreciation and amortization. It is also affected by write-downs, like a negative change in the goodwill of an asset.
These are accounting expenses that don't lead to reduced cash, but they do affect the company's earnings because that's how the accounting rules are.
A company can also spread its capital expenditures out over time on the income statement.
If a company spends a certain amount of cash on a capital asset, like a new factory, then it hits the cash flow statement immediately and causes a reduction in free cash flow.
But the company can "capitalize" the expense, which means that it gets spread out over several years on the income statement. So it doesn't show up in the earnings number right away.
This can lead to a smoothing out of earnings because they are less sensitive to big irregular expenses. It's also the reason why the free cash flow number can be lumpy — major cash expenses are accounted for immediately.
If a company has stable capital expenditures each year, then free cash flow should approximate the earnings and follow a similar trend.
The P/FCF ratio and free cash flow yield
The popular P/E ratio can be modified to use free cash flow instead. You simply replace the E (earnings) with FCF (free cash flow).
The P/FCF ratio can be calculated by dividing the stock price with the amount of free cash flow per share. You can also divide the company's market cap with the total free cash flow in the past 12 months.
The FCF yield is the inverse of the P/FCF ratio. You get this number by dividing the free cash flow in the past 12 months with the market cap.
The FCF yield can be a useful metric for dividend investors. For example, if a stock has a dividend yield of 2% but an FCF yield of 6%, then the dividend is likely safe, and there may even be room to increase it.
However, make sure to look at the trend over several years before making any decisions. Sometimes the P/FCF ratio and FCF yield can be misleading due to the lumpiness of free cash flow.
Different types of free cash flow
Using the simple formula mentioned above (FCF = Operating Cash Flow - Capital Expenditures) is sufficient for investors who want to keep things simple.
But there are also two more types of free cash flow that some investors use:
Free cash flow to the firm (FCFF)
FCFF is also termed unlevered free cash flow because it excludes the impact of leverage (debt), so it does not account for debt in its calculations.
It is the amount of cash a business generates for all investors, including both shareholders and bondholders.
Formula: FCFF = Operating Cash Flow + (Interest Expense * (1 - Tax Rate)) - Capital Expenditures
Free cash flow to equity (FCFE)
FCFE is also termed levered free cash flow because it includes the impact of leverage (debt) in the calculation. It is the amount of cash made for shareholders only.
Formula: FCFE = Operating Cash Flow - Capital Expenditures + Net Debt Issued (Repaid)
The bottom line
Companies with positive free cash flows are generating more cash than they need.
They can return this cash to shareholders via dividends or share buybacks, pay back debts, or use the money for some bigger investments like acquisitions.
Unlike earnings, it is more difficult to manipulate the free cash flow number using accounting tricks. Because of this, some investors see it as a more accurate measure of profitability.