Tyson Foods, Inc. (FRA:TF7A)
 Germany · Delayed Price · Currency is EUR
 | Market Cap | 19.53B -0.7% |
| Revenue (ttm) | 46.86B +2.8% |
| Net Income | 170.00M -81.0% |
| EPS | 0.48 -81.1% |
| Shares Out | n/a |
| PE Ratio | 114.91 |
| Forward PE | 15.30 |
| Dividend | 1.74 (3.21%) |
| Ex-Dividend Date | Feb 27, 2026 |
| Volume | n/a |
| Average Volume | 83 |
| Open | 54.24 |
| Previous Close | 52.68 |
| Day's Range | 54.24 - 54.24 |
| 52-Week Range | 43.42 - 58.72 |
| Beta | n/a |
| RSI | 58.43 |
| Earnings Date | Feb 2, 2026 |
About Tyson Foods
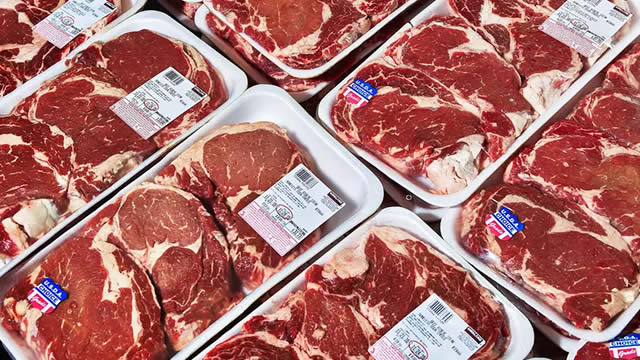
Tyson Foods, Inc., together with its subsidiaries, operates as a food company worldwide. It operates through four segments: Beef, Pork, Chicken, and Prepared Foods. The company processes live fed cattle and hogs; fabricates dressed beef and pork carcasses into primal and sub-primal meat cuts, as well as case ready beef and pork, and fully cooked meats; raises and processes chickens into fresh, frozen, and value-added chicken products, including breaded chicken strips, nuggets, patties, and other ready-to-fix or fully cooked chicken parts; and s... [Read more]
Financial Performance
In fiscal year 2025, Tyson Foods's revenue was $54.44 billion, an increase of 2.12% compared to the previous year's $53.31 billion. Earnings were $474.00 million, a decrease of -40.75%.
Financial numbers in USD Financial StatementsNews
Tyson Foods: Improvements Look Priced In Here, But Rising Protein Demand Could Be A Catalyst
Tyson Foods (TSN) is benefiting from a shift toward healthier consumer behavior and rising protein demand, supporting recent outperformance. TSN delivered solid Q1 results with revenue up 5.1% and str...

Jimmy Dean® Protein Lineup Expands with New Bowls Featuring 40 Grams of Protein
SPRINGDALE, Ark., March 16, 2026 (GLOBE NEWSWIRE) -- As consumers increasingly prioritize protein, the Jimmy Dean ® brand is introducing a new lineup of high protein options that deliver up to 40 gram...

Tyson Foods Strengthens Razorback Partnership with Landmark Athletics Sponsorship of All Varsity Sports
SPRINGDALE, Ark., March 04, 2026 (GLOBE NEWSWIRE) -- Tyson Foods and the University of Arkansas Department of Intercollegiate Athletics announced today an expanded partnership, introducing one of the ...
High Dividend Packaged Foods: Relative Favorability
The packaged foods industry has broadly declined over the last year with some producers dropping over 20%; dividend yields have expanded to as much as 9.5%. However, a high dividend yield does might n...
Tyson Foods Still Needs To Prove This Time Is Different
Tyson Foods has rebounded over 25% since October lows, yet long-term returns remain lackluster despite recent operational improvements. Tyson Foods trades at 8x EBITDA and ~16x FY 2026 free cash flow,...

Tyson Foods, Inc. Announces Pricing of Senior Notes Offering
SPRINGDALE, Ark., Feb. 10, 2026 (GLOBE NEWSWIRE) -- Tyson Foods, Inc. (the “Company” or “we”) (NYSE: TSN) announced today that it has agreed to sell $500 million aggregate principal amount of its 4.95...
Tyson Foods, Inc. (TSN) Shareholder/Analyst Call Prepared Remarks Transcript
Tyson Foods, Inc. (TSN) Shareholder/Analyst Call Prepared Remarks Transcript

Tyson Foods Announces Quarterly Dividend
SPRINGDALE, Ark., Feb. 04, 2026 (GLOBE NEWSWIRE) -- The Board of Directors of Tyson Foods (NYSE: TSN), at a meeting on February 4, 2026, declared a quarterly dividend of $0.51 per share on Class A com...
Tyson Foods, Inc. (TSN) Q1 2026 Earnings Call Transcript
Tyson Foods, Inc. (TSN) Q1 2026 Earnings Call Transcript
Tyson Foods: Fairly Valued Given Slow Recovery In Beef (Downgrade)
Tyson Foods: Fairly Valued Given Slow Recovery In Beef (Downgrade)

Tyson Foods Tops Earnings Estimates on Strong Chicken Sales. The Stock Is Falling.
The meat processor beats earnings and revenue estimates for its fiscal first quarter.
Tyson Foods beats quarterly profit estimates on chicken demand
U.S. meatpacker Tyson Foods reported higher-than-expected quarterly earnings on Monday, as increased demand for its chicken products overshadowed hefty losses in its beef business.

Tyson Foods Reports First Quarter 2026 Results
SPRINGDALE, Ark., Feb. 02, 2026 (GLOBE NEWSWIRE) -- Tyson Foods, Inc. (NYSE: TSN), one of the world's largest food companies and a recognized leader in protein with leading brands including Tyson, Jim...

NFM Announces Leadership Transition: Bob Tyson Appointed CEO, LaTasha Waddy Named President
NFM Lending is pleased to announce a strategic leadership transition. Bob Tyson has moved from President to Chief Executive Officer. Chief Legal Counsel and SVP LaTasha Waddy has been named President ...

Tyson Foods to Hold Annual Meeting of Shareholders
SPRINGDALE, Ark., Jan. 12, 2026 (GLOBE NEWSWIRE) -- Tyson Foods, Inc. (NYSE: TSN) will hold its Annual Meeting of Shareholders on Thursday, February 5, 2026 at 11:00 a.m. Eastern time (10 a.m. Central...
Tyson Foods: Protein Powerhouse Set To Benefit From The New Food‑Pyramid Shift
Tyson Foods, Inc. is the largest U.S. meat processor, benefiting from a national shift toward protein-rich diets and updated government nutrition guidelines. TSN's chicken segment has returned to prof...

RFK Jr's Food Pyramid Could Mean Family Grocery Bills Of $36,400 A Year: Stocks Poised To Win Or Lose
New food guidelines shared by Health and Human Services Secretary Robert F. Kennedy Jr. this week have consumers, health experts and food companies taking note.

Tyson Foods Announces First Quarter Earnings Conference Call and Webcast
SPRINGDALE, Ark., Jan. 05, 2026 (GLOBE NEWSWIRE) -- Tyson Foods, Inc. (NYSE: TSN) will release first quarter 2026 financial results on Monday, February 2, 2026. Management will host a conference call ...

Tyson Foods: Recovery Picks Up Pace Even As Demand Softens
Tyson Foods (TSN) is rated Buy with a $70.27 price target, reflecting a 20.76% upside based on DCF and sector multiples. TSN's competitive scale and processing capacity position it to capitalize on be...

Tyson Foods to close major beef plant, scale back operations as cattle supplies decline
Tyson Foods will close its Nebraska beef plant affecting 3,200 workers and scale back Texas operations as cattle shortages force major industry restructuring.
Tyson to Close One of the Biggest Beef-Processing Plants in the U.S.
The largest meat supplier in the U.S. has lost more than $425 million on beef this year, despite near record-high prices.

Tyson Foods will stop calling its beef ‘net zero' and ‘climate smart' after lawsuit from environmental group
Tyson Foods has agreed to stop making claims about reaching “net zero” or selling “climate-smart” beef for at least five years, part of a settlement from a lawsuit brought against it by the nonprofit ...
Tyson Foods to halt carbon emissions claims, environmental group says
Tyson Foods has agreed to stop saying it will reach net-zero greenhouse gas emissions by 2050 and marketing beef as climate friendly to settle a lawsuit that accused the U.S. meat company of misleadin...

The Score: Tyson, Robinhood, Walmart, Paramount Skydance and More Stocks That Defined the Week
Here are some of the major companies whose stocks moved on the week's news.
Tyson Foods: Recent Dividend Increase Shows Inflation Headwinds Continue To Linger (Rating Upgrade)
Tyson Foods offers an appealing dividend yield above 3% and trades at a forward P/E below the sector median, attracting income-focused investors. Recent earnings highlight strong top- and bottom-line ...