Balance Sheet
 Written by Kris Gunnars, BSc
A balance sheet is a financial statement for a company that shows its assets, liabilities, and equity at a point in time.
In other words, the balance sheet lists everything that a company owns (assets), owes (liabilities), and the difference between them (equity = assets - liabilities).
Examples of assets are cash and inventory. Examples of liabilities are long-term debt and unpaid bills.
The difference between assets and liabilities is termed shareholders' equity, which is sometimes called book value or net worth.
If a company has more assets than liabilities, shareholders' equity (book value) is a positive number. If liabilities are greater than assets, then it is a negative number.
The balance sheet is one of the three core financial statements that publicly traded companies release each quarter. The other two are the income statement and cash flow statement.
Informed investors need to know how to interpret the three core financial statements.
Formula: the balance sheet equation
The balance sheet shows everything that a company owns, termed assets.
But it also shows how those assets were financed, either with liabilities (like debt) or equity (like money from investors).
The balance sheet formula is based on an accounting equation with assets on one side and liabilities and equity on the other side. Both numbers should balance each other out.
Formula: Assets = Liabilities + Equity
If you add up all the assets, that number is the same as when you add up all the liabilities and equity. The balance sheet balances the two sides.
The fundamental assumption is that a company needs to pay for everything it owns somehow. This can be done either by getting it from investors (shareholders equity) or borrowing it (liabilities).
For example, if a company gets a loan for $1 million, then the cash portion of the assets goes up by $1 million, and liabilities go up by $1 million.
Also, if a company IPOs and gets $1 million from investors, then cash goes up by $1 million, and shareholders' equity goes up by $1 million.
In both cases, the numbers on the two sides of the balance sheet equation remain equal.
Sample balance sheet
This is a simplified balance sheet for a hypothetical company:
| Assets | Amount ($) | Liabilities | Amount ($) |
|---|---|---|---|
| Current assets | Current liabilities | ||
| Cash on hand | $10,000 | Accounts payable | $40,000 |
| Cash in bank | $90,000 | Current debt | $30,000 |
| Inventory | $100,000 | Taxes owed | $30,000 |
| Receivables | $50,000 | ||
| Total current assets | $250,000 | Total current liabilities | $100,000 |
| Non-current assets | Non-current liabilities | ||
| Real estate | $250,000 | Long-term debt | $300,000 |
| Equipment | $50,000 | ||
| Total non-current assets | $300,000 | Total non-current liabilities | $300,000 |
| Shareholders' equity | |||
| Common stock | $100,000 | ||
| Retained earnings | $50,000 | ||
| Total shareholders' equity | $150,000 | ||
| Total assets | $550,000 | Liabilities + Equity | $550,000 |
As you can see, the two sides balance each other out on the balance sheet. Total assets are equal to liabilities plus equity.
The balance sheet reflects a single time point
The balance sheet shows a snapshot of a company's finances at a single point in time, usually the last day of the fiscal quarter or fiscal year that is being reported.
But it's important to be aware of changes and trends to see how a company is doing, so it helps to look at several balance sheets for different time points.
If you are analyzing a stock, then the balance sheet typically shows more than one time period. For example, it may show the breakdown for two or three consecutive years, so investors can see how the numbers evolved over time.
Real-world example
Publicly traded companies tend to be really big and complex.
They are often split into many different parts that are individually so big that they could be large companies on their own.
However, their financial statements can be fairly easy to interpret because all the items are combined into categories that are often similar between companies.
Balance sheets for publicly traded companies are usually organized by listing the assets first, then the liabilities, then the shareholders' equity.
Below is an example of a balance sheet for a real publicly traded company: Tesla.
This is a screenshot of Tesla's balance sheet for 2019 that highlights the key line items we've been discussing (assets, liabilities, and shareholders' equity).
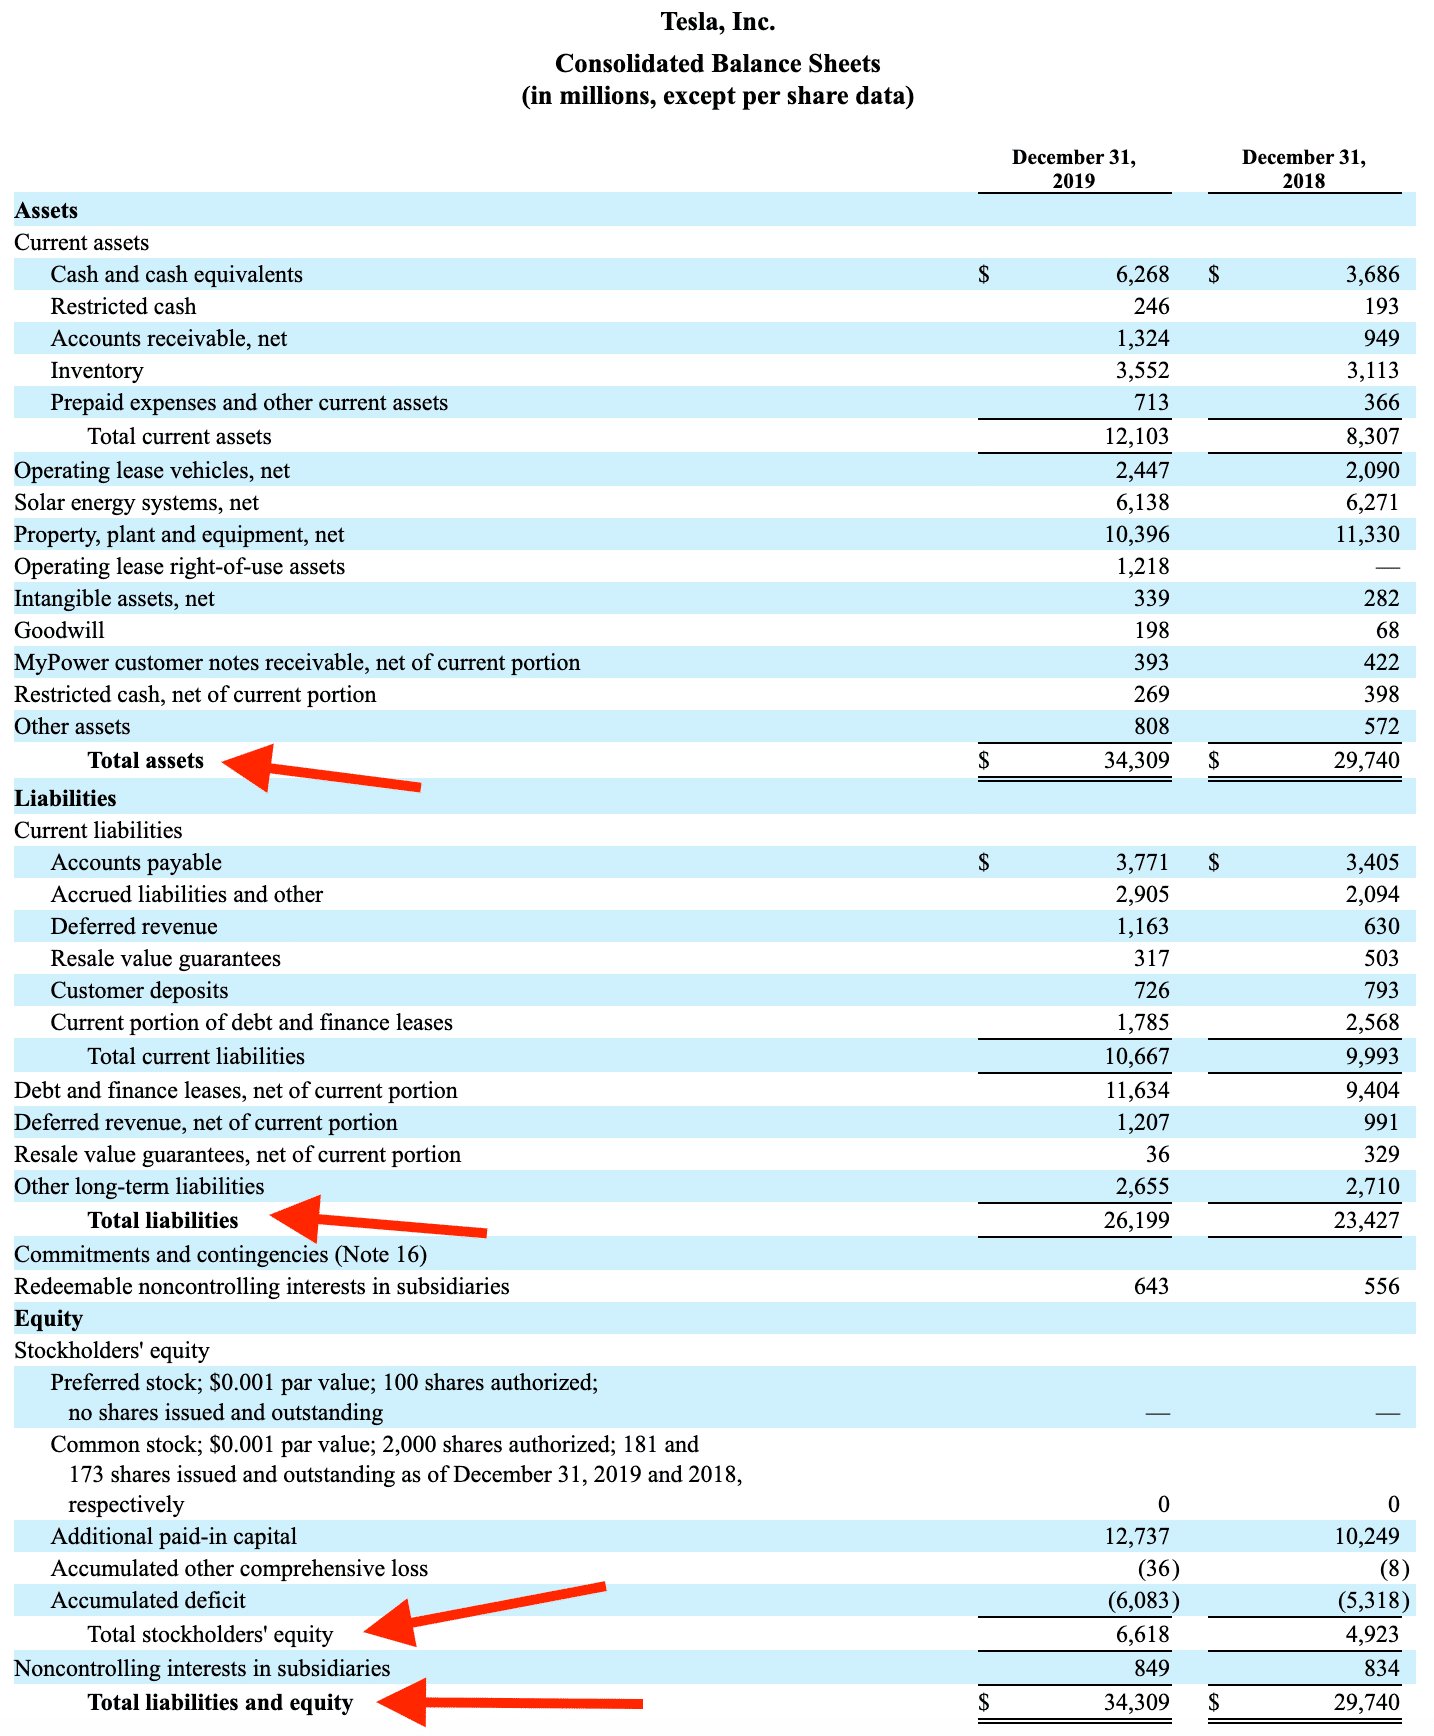
Source: Tesla's Balance Sheet
As you can see, Tesla's biggest assets are cash and equivalents. Their biggest liabilities are debt and finance leases.
Balance sheet components
As mentioned above, a balance sheet typically has three main sections:
- Assets: Everything that the company owns (like cash or inventory).
- Liabilities: Everything that the company owes (like debt).
- Shareholders' equity: This is the difference between assets and liabilities, often referred to as the company's book value or net worth.
For most publicly traded companies, assets and liabilities are split into current (short-term) and non-current (long-term) categories:
- Current: Current assets are things that can be easily sold for cash or assets that will be used within a year. Current liabilities are due within a year.
- Non-current: Non-current assets are things that can not be sold quickly or will be used over many years. Non-current liabilities are due after more than one year.
The exact line items on the balance sheet vary between different businesses. Sometimes the same terms have different implications depending on the company.
Below are some of the most commonly found line items on balance sheets for publicly traded companies, with brief explanations of what each one means.
Current assets
Current assets are listed near the top of the balance sheet. In this case, current means "short-term."
These are things the company owns that can easily be sold for cash or will be used within one year. Examples include short-term bonds and inventory.
Examples of current assets:
- Cash and equivalents: This is straight cash that the company has on hand or financial products like short-term bonds that can be easily converted into cash.
- Inventory: Finished goods or materials to produce goods that the company plans on selling to customers. This is a major balance sheet item for retailers.
- Accounts receivable: Money owed to the company for products or services that have been provided but not yet paid for by customers.
Non-current assets
Non-current assets are listed below current assets. Non-current means "long-term."
These are things that the company owns that can not easily be sold for cash or will be owned for the long-term, as in more than one year. Examples include real estate and factory equipment.
Examples of non-current assets:
- Property, plant & equipment (PP&E): Includes items like machinery, equipment, factories, and warehouses that are used for production and delivery.
- Intangible assets: These can include things like goodwill, patents and intellectual property that the company acquired.
It's important to make a distinction between tangible and intangible assets.
Tangible assets are usually fixed physical items or things with a clear dollar value. Intangible assets are non-physical things like the value of patents, trademarks, copyrights, etc.
Current liabilities
Current liabilities are financial obligations that the company owes and are due within a year.
Examples of current liabilities:
- Accounts payable: Money that the company owes to suppliers and others. The services or products have been purchased on credit but not yet paid for.
- Current debt: This is debt that is due to be paid within one year.
- Current portion of long-term debt: Part of long-term debt, which is a non-current liability, but has become "current" because it is due within one year.
Non-current liabilities
Non-current liabilities are things that the company owes that are due after more than one year.
- Long-term debt: This is debt that does not need to be paid until after more than one year. It can include bank loans and bonds that the company has issued.
You can find details about a company's debt in its quarterly report (10Q) and annual report (10K). It should include details like when the debt is due and how high the interest rate on the debt is.
Shareholders' equity
Shareholders' equity, also called book value or net worth, is the amount of money held by investors inside the company. It can be calculated by subtracting total liabilities from total assets.
Formula: Shareholders' Equity = Total Assets - Total Liabilities
These are the most common line items in the shareholders' equity portion of the balance sheet:
- Common stock: The par value of the common stock multiplied by the number of shares. This information is not very useful as the par value is arbitrary, often one cent.
- Additional paid-in capital: This is the difference between the par value of the common stock and the amount paid by investors for the stock. It is the money that investors have put into the company in exchange for stock.
- Retained earnings: These are previous earnings that are being held by the company and have not been paid out as dividends. They can be used to pay debts, reinvest in the business, or return money to shareholders.
If the company has lost money in the past, then retained earnings are replaced with a line item called "accumulated deficit," which is a negative number.
Having accumulated deficit instead of retained earnings is not necessarily a bad thing. Companies that are growing rapidly often have losses while they are reinvesting everything into the business to gain market share.
Financial ratios and metrics
You can use information from the balance sheet to calculate many different financial ratios and metrics. These include:
- Current ratio: Measures the company's short-term liquidity. You calculate it by dividing current assets by current liabilities.
- Quick ratio: Also called the acid-test ratio, it measures short-term liquidity. It is calculated by adding cash and equivalents, marketable securities, and accounts receivables, then dividing that number by current liabilities.
- Debt to equity: A measure of the company's leverage, calculated by dividing total liabilities by shareholders' equity.
- Book value: This is identical to shareholders' equity, calculated by subtracting total liabilities from total assets.
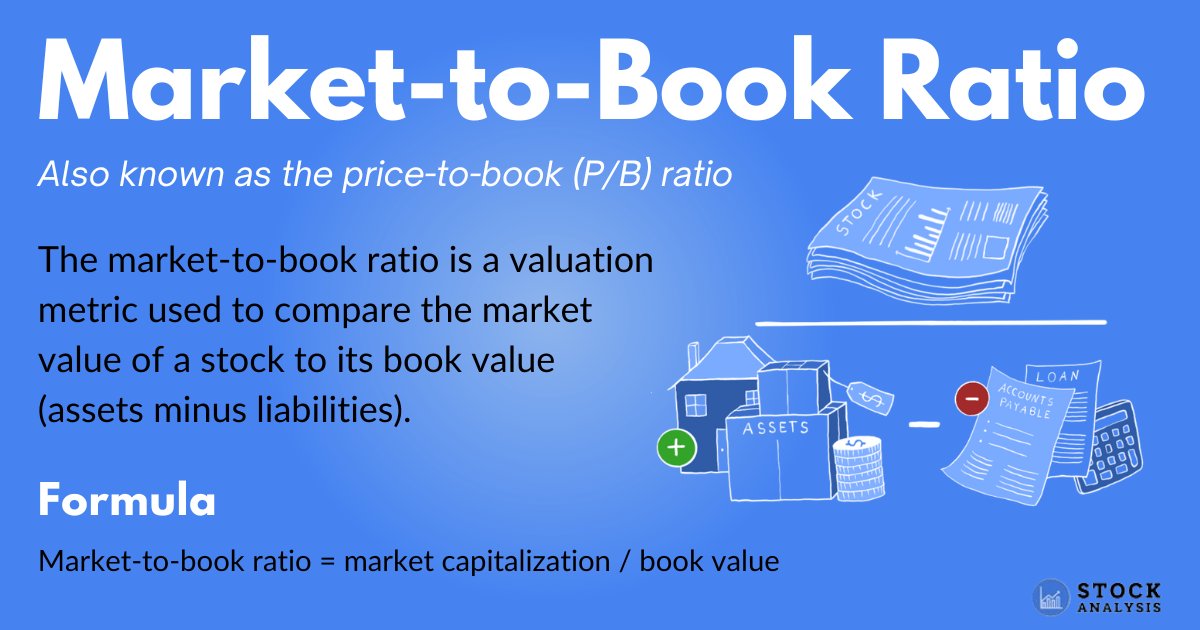
- Price to book ratio: Also called the market to book ratio, it is calculated by dividing the stock price by the book value or shareholders' equity.
- Return on equity (ROE): Measures how much earnings the company makes relative to its equity. You calculate it by dividing the company's net income by the shareholders' equity.
- Return on assets (ROA): This is how efficient the company is at using its assets to produce profits. You can calculate it by dividing net income by total assets.
- Return on invested capital (ROIC): Measures the company's effectiveness at allocating capital to produce profits. Calculating it is a little more complicated than calculating ROE and ROA.
When you see these ratios and metrics reported on finance websites, then they are calculated using numbers on the company's balance sheet and income statement.