Income Statement
 Written by Kris Gunnars, BSc
The income statement is a financial statement that shows a company's revenues and expenses over a specific time period and whether they amount to profits or losses.
It is one of the three core financial statements, the others being the balance sheet and the cash flow statement.
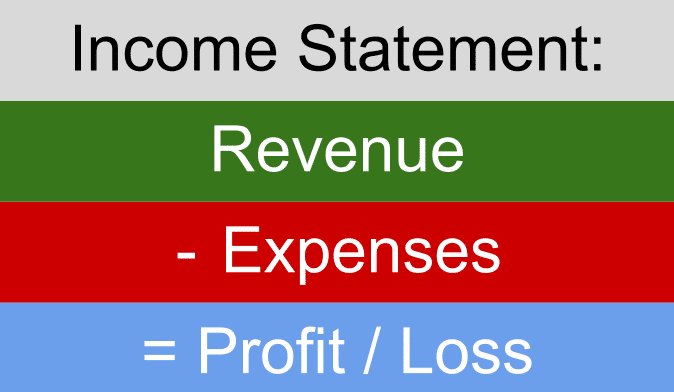
On the income statement, revenue is listed at the top and is often referred to as the "top-line."
All the key costs and expense items are listed below and then subtracted from the revenue. After all the expenses have been subtracted, the profit or loss is listed near the bottom of the statement. The profit/loss is termed the "bottom-line."
Publicly traded companies release income statements for each quarter and each year in their quarterly and annual reports.
Investors and analysts closely follow the income statements of companies because they give a good overview of how different parts of the business are performing.
The income statement also shows how effective the company is at managing its expenses and transforming revenues into profits.
The income statement is sometimes called the profit and loss statement, P&L statement, earnings statement, statement of operations, or some other variation of these terms.
The three core financial statements
Publicly traded companies release the income statement, balance sheet, and cash flow statement each quarter and each year.
Their reports are called 10Q (quarterly) and 10K (annual). They are sent to the SEC in accordance with generally accepted accounting principles (GAAP).
Here's a quick overview of what the three core financial statements are for:
- Income statement: Shows how much of the company's revenue is left as profits after subtracting all costs and expenses.
- Balance sheet: Shows everything that the company owns and owes. What the company owns is called assets, but what it owes is called liabilities. The difference between the assets and liabilities is called equity, or book value.
- Cash flow statement: Shows how cash flows in and out of the company. It includes how much cash the company receives from different sources and how much cash it pays for different expense items.
Income statement examples
The income statement shows how revenue and expenses ultimately amount to profits or losses for a company.
But this calculation involves many different line items. The income statement shows how each line item for revenue and expenses contributes to the bottom line.
In addition, there are often non-operating gains and losses included in the income statement. This is money that the company gains or loses that is not related to the core business. Examples include profits from selling an asset or losses from a lawsuit.
Although income statements may seem complicated at first glance, the calculations are simple. They involve simple addition and subtraction.
Example: hypothetical newspaper business
Here's an example of a hypothetical income statement for a newspaper business. Its revenue comes from two sources: ad sales and paid subscriptions.
| 2025 | 2024 | |
|---|---|---|
| Revenue | ||
| Advertising | $1,000,000 | $800,000 |
| Subscriptions | $400,000 | $300,000 |
| Total revenue | $1,400,000 | $1,100,000 |
| Cost of materials | -$1,150,000 | -$850,000 |
| Gross Profit | $300,000 | $250,000 |
| Operating Expenses | ||
| Salaries | -$40,000 | -$30,000 |
| Rent | -$50,000 | -$50,000 |
| Marketing | -$110,000 | -$50,000 |
| Operating Income | $100,000 | $120,000 |
| Interest | -$30,000 | -$20,000 |
| Taxes | -$10,000 | -$10,000 |
| Net Income | $60,000 | $90,000 |
This hypothetical business had more revenue in 2025 compared to 2024. But their profits were lower, because some expense items grew more than the revenue.
Example: income statement for a real company
Apple (AAPL) is a complicated business with many different sources of revenue and expenses. Their income statement is a great way to see a simplified overview of how the business is performing.
Here's a screenshot of Apple's income statement from 2025. Apple calls its statement "consolidated statements of operations."
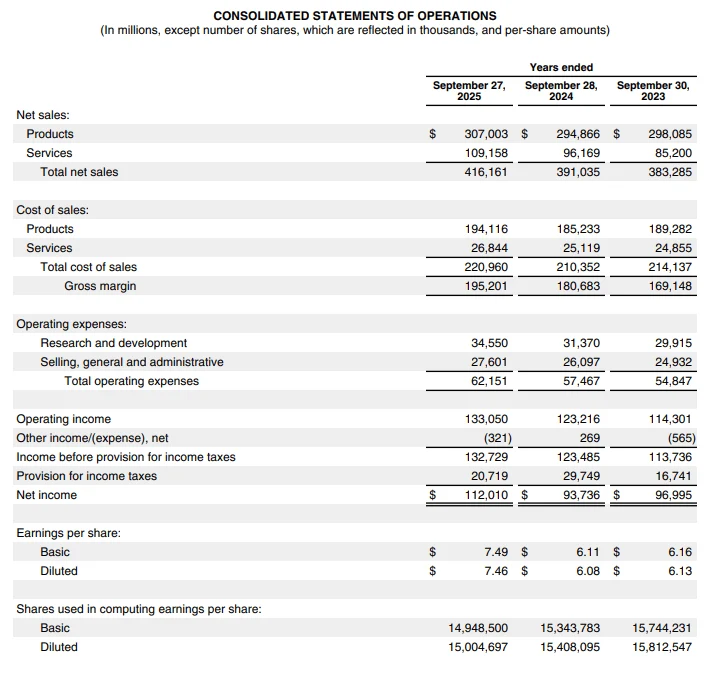
As you can see, Apple puts its revenue and the cost of revenue into two categories — products and services. Their top expenses are the cost of sales, research and development, selling, general and administrative, and taxes.
Publicly traded companies also list the number of shares outstanding on the income statement. Then they calculate earnings per share (EPS) by dividing the net income/loss by the number of shares outstanding.
Most publicly traded companies report their expenses by function instead of by nature. For example, they put salaries under "research and development" or "selling, general and administrative" instead of having a line item specifically for salaries.
Single-step vs. multi-step income statements
It's important to be aware of the difference between single-step and multi-step income statements.
As the names imply, single-step income statements calculate everything in one step, while multi-step income statements have several steps.
A single-step income statement simply adds up all the revenue, then subtracts all the expenses in one step.
Single-step income statement:
- Revenue - Expenses = Net Income
However, multi-step income statements have four steps, each arriving at a different level of income. A multi-step income statement calculates gross profit, operating income, pre-tax income, and net income (profit or loss).
Multi-step income statement:
- Revenue - Cost of Revenue = Gross Profit
- Gross Profit - Operating Expenses = Operating Income
- Operating Income - Other Expenses + Other Gains = Pre-Tax Income
- Pre-Tax Income - Taxes = Net Income/Loss
Most publicly traded companies release multi-step income statements, which are more useful for investors and analysts. However, it is usually possible to calculate the different levels of income for single-step income statements.
Income statement components
There are some differences between the income statements of different companies.
However, they all follow the same general structure. They start with revenue at the top and then subtract and add until arriving at the bottom line profit or loss.
Below are explanations of common components that you will see on most (but not necessarily all) income statements.
Revenue, cost of revenue, and gross profit
The top part of the income statement shows how revenue gets transformed into gross profit.
The three main items are:
- Revenue: The total amount of money the company gets from its ongoing core operations. For example, sales of products and services.
- Cost of revenue: Also called the cost of goods sold, this is money spent on making or selling the products that directly drive the revenue.
- Gross profit: Subtracting the cost of revenue from revenue gives the gross profit, also called gross income.
Although it is not usually shown on the income statement, you can calculate the gross margin by dividing the gross profit by the revenue. Gross Margin = Gross Profit / Revenue.
Analysts often keep close track of the gross margin, especially for companies that have a high cost of revenue.
It's important to keep in mind that publicly traded companies in the US base their numbers on accrual-based accounting, which means that the revenue or expense has been recognized, but the cash may not have changed hands yet.
For example, a company can register revenue at the time when a product was delivered to a customer, even if the customer won't pay for it until 30 days later.
To see how actual cash flows in and out of the company's accounts, you need to look at the cash flow statement.
Operating expenses and operating income
Next up is operating expenses, a major expense category that is often a key determinant of whether a company ends up with a profit or loss.
These are some common items to be aware of:
- Research and development: Money spent on researching and developing new products or services that support the current business or may become new sources of revenue in the future.
- Selling, general and administrative: This is a broad category that contains various costs and expenses not related to production. Examples include sales, marketing, administrative functions, and various others.
- Operating income: After all operating expenses have been subtracted from the gross profit, the amount that is left is the operating income. This is the profitability number for the core operations of the business.
You can calculate the operating margin by dividing the operating income by the revenue. Operating Margin = Operating Income / Revenue.
Interest, taxes, and other gains/losses
Listed below the operating income are non-operating income and expense items. These items are not directly related to the core functions of the business.
Here are some of the most common ones:
- Interest income/expense: Interest on the company's cash holdings or debt will be listed here as interest income or expense.
- Investment gains/losses: These can be significant if the company owns stocks or other investments that tend to go up and down in price.
- Other income/loss: Other types of income or expenses that are not significant enough to warrant entire categories.
- Income before taxes: Companies usually list their pre-tax income here. It is calculated by subtracting all non-operating gains and expenses (except taxes) from the operating income.
- Provision for income taxes: This is the amount of money reserved for paying taxes.
Net income and earnings per share
Finally, the bottom line is calculated by subtracting taxes from the pre-tax income.
These are the most common items for the bottom-line part of the income statement:
- Net income/loss: If all expenses are lower than revenue, then net income is positive and the company has a net profit. If expenses are higher, then the company will show a negative number and a net loss.
- Shares outstanding: The total number of shares that have been issued.
- Earnings per share: EPS is calculated by dividing the net income/loss by the number of shares outstanding.
The profit margin can be calculated by dividing the net income by the revenue. Profit Margin = Net Income / Revenue.
Companies often show shares outstanding and EPS as either "basic" or "diluted." Basic is for all currently outstanding shares, but diluted includes stock options and others that may eventually convert into common stock.
Continuing vs. discontinued operations
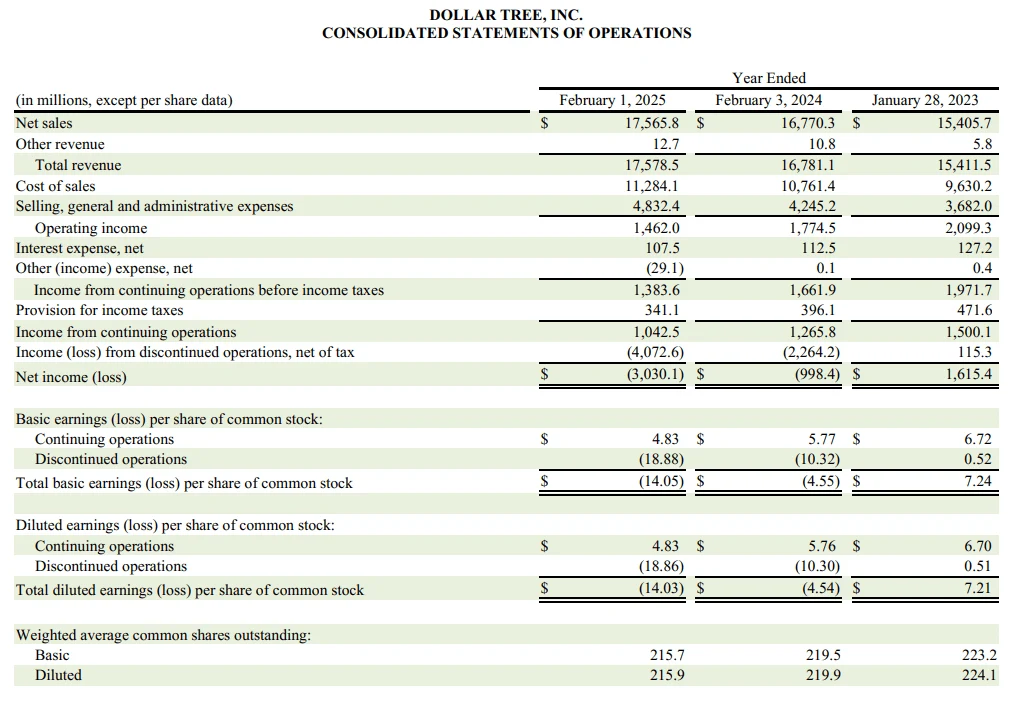
If a company sells a significant part of its business, then it will show the numbers from that part separately under discontinued operations.
Here's an example from Dollar Tree's (DLTR) income statement for 2025. They sold off a big part of their business, so many of the financials are broken down into continuing and discontinued categories.
More facts about income statements
Here are some more things that are worth knowing about income statements:
- The revenue and expenses are usually determined using the accrual basis of accounting, meaning that they may have been accounted for but not received or paid in cash yet.
- The income statement measures a business's profitability, not cash flow. Look at the cash flow statement to see how cash flows in and out of the company.
- A company can have its own internal income statement and even create separate income statements for different parts of the business. They may do this monthly rather than just quarterly or yearly.
- Sometimes the year-over-year (YoY) change in financials is shown on the income statement, for example, for revenue growth.
- You can calculate many financial metrics using only numbers from the income statement. This includes the gross margin, operating margin, profit margin, sales per share, and others.
- Because of accounting rules, numbers on the income statement are often affected by accounting items and rules that do not reflect any changes in cash.
- Major one-time gains or expenses are often put into other line items on the income statement, making them much bigger or smaller than they are normally.
- The quarterly and annual reports of companies often publish notes along with the income statements that explain some of the numbers.
- Some companies release adjusted (non-GAAP) numbers for investors and analysts that exclude non-recurring expense items. These include adjusted EPS and adjusted EBITDA.
The bottom line
Stock analysts closely follow income statements and use them for financial modeling.
Having access to income statements is very useful for stock investors because they show how the business is performing and how effective its management is.
Understanding how the income statement, balance sheet, and cash flow statement work is crucial in order to be a well-informed stock investor.