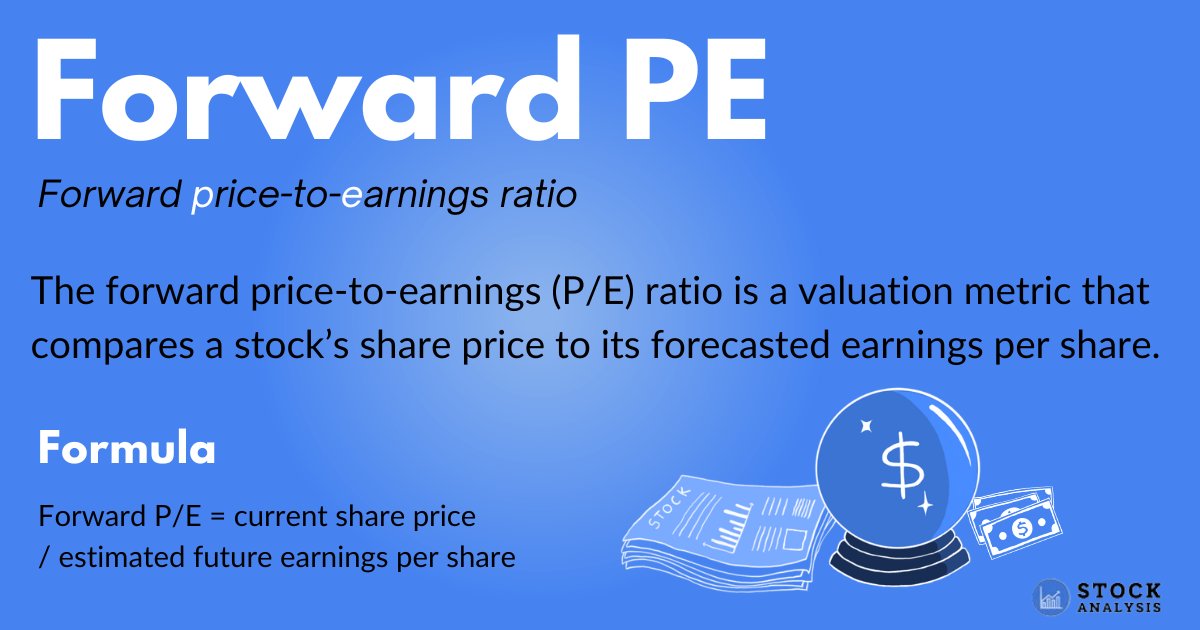
Forward P/E Ratio


The forward price-to-earnings (P/E) ratio is a valuation metric that compares a stock's share price to its forecasted earnings per share.
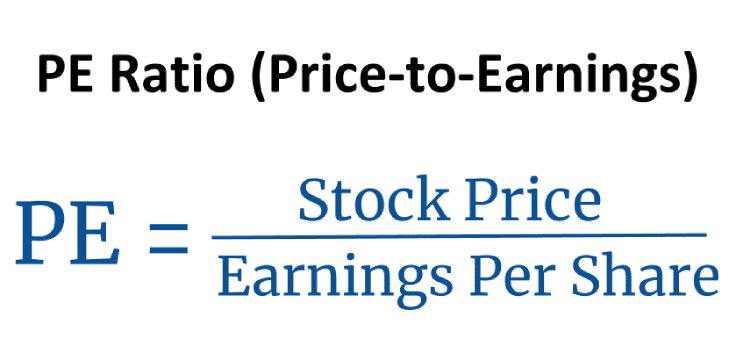
It's calculated by dividing the current share price by the estimated future earnings per share for the next 12 months or fiscal year:
Forward P/E = current share price / estimated future earnings per share
Because this metric relies on an estimate, it may not be as accurate as those that use historical financial data. Nevertheless, forward P/E is widely used as a comparison metric and is seen as an indication of the market's optimism about a company's prospects.
The P/E ratio is also known as the earnings multiple or price multiple.
Below is an overview of forward P/E including how to calculate it, how it compares to trailing P/E, and what's considered to be a “good” forward P/E.
What is forward P/E?
The price-to-earnings (P/E) ratio is a popular stock valuation metric that looks at share price compared to earnings per share.
You can use this valuation to compare a company to its peers or sector, assess how a stock is valued, or evaluate the market's prospects overall.
There are two ways to calculate the P/E ratio: trailing (looking back) and forward (future) P/E.
The forward price-to-earnings (P/E) calculation compares a stock's current share price to its forecasted earnings per share. In contrast, a stock's trailing P/E simply compares the share price to the last 12 months or last fiscal year of actual earnings.
However, using forward P/E does involve some risk, as the company's real earnings may be much different than the forecasted earnings used in the calculation.
Nevertheless, forward P/E can provide a good indication of how the market feels about a company's future growth prospects.
Overall, if the forward P/E is projected to be lower than the current P/E ratio, this means analysts expect earnings to increase. If the forward P/E is higher, then the opposite is true.
You can also look at both trailing and forward P/E or even combine the two to form a well-rounded view of a company that looks both forward and backward.
SummaryThe forward price-to-earnings (P/E) ratio compares a stock's current share price to its forecasted earnings per share. This can be used to assess the value of a stock and get a sense of how the market views the company's prospects.
How to calculate forward P/E
Forward P/E is calculated as follows:
Forward P/E = current share price / estimated future earnings per share
To determine forward P/E, you can either calculate it yourself or find it listed online. Either way, it's useful to see how the calculation is made.
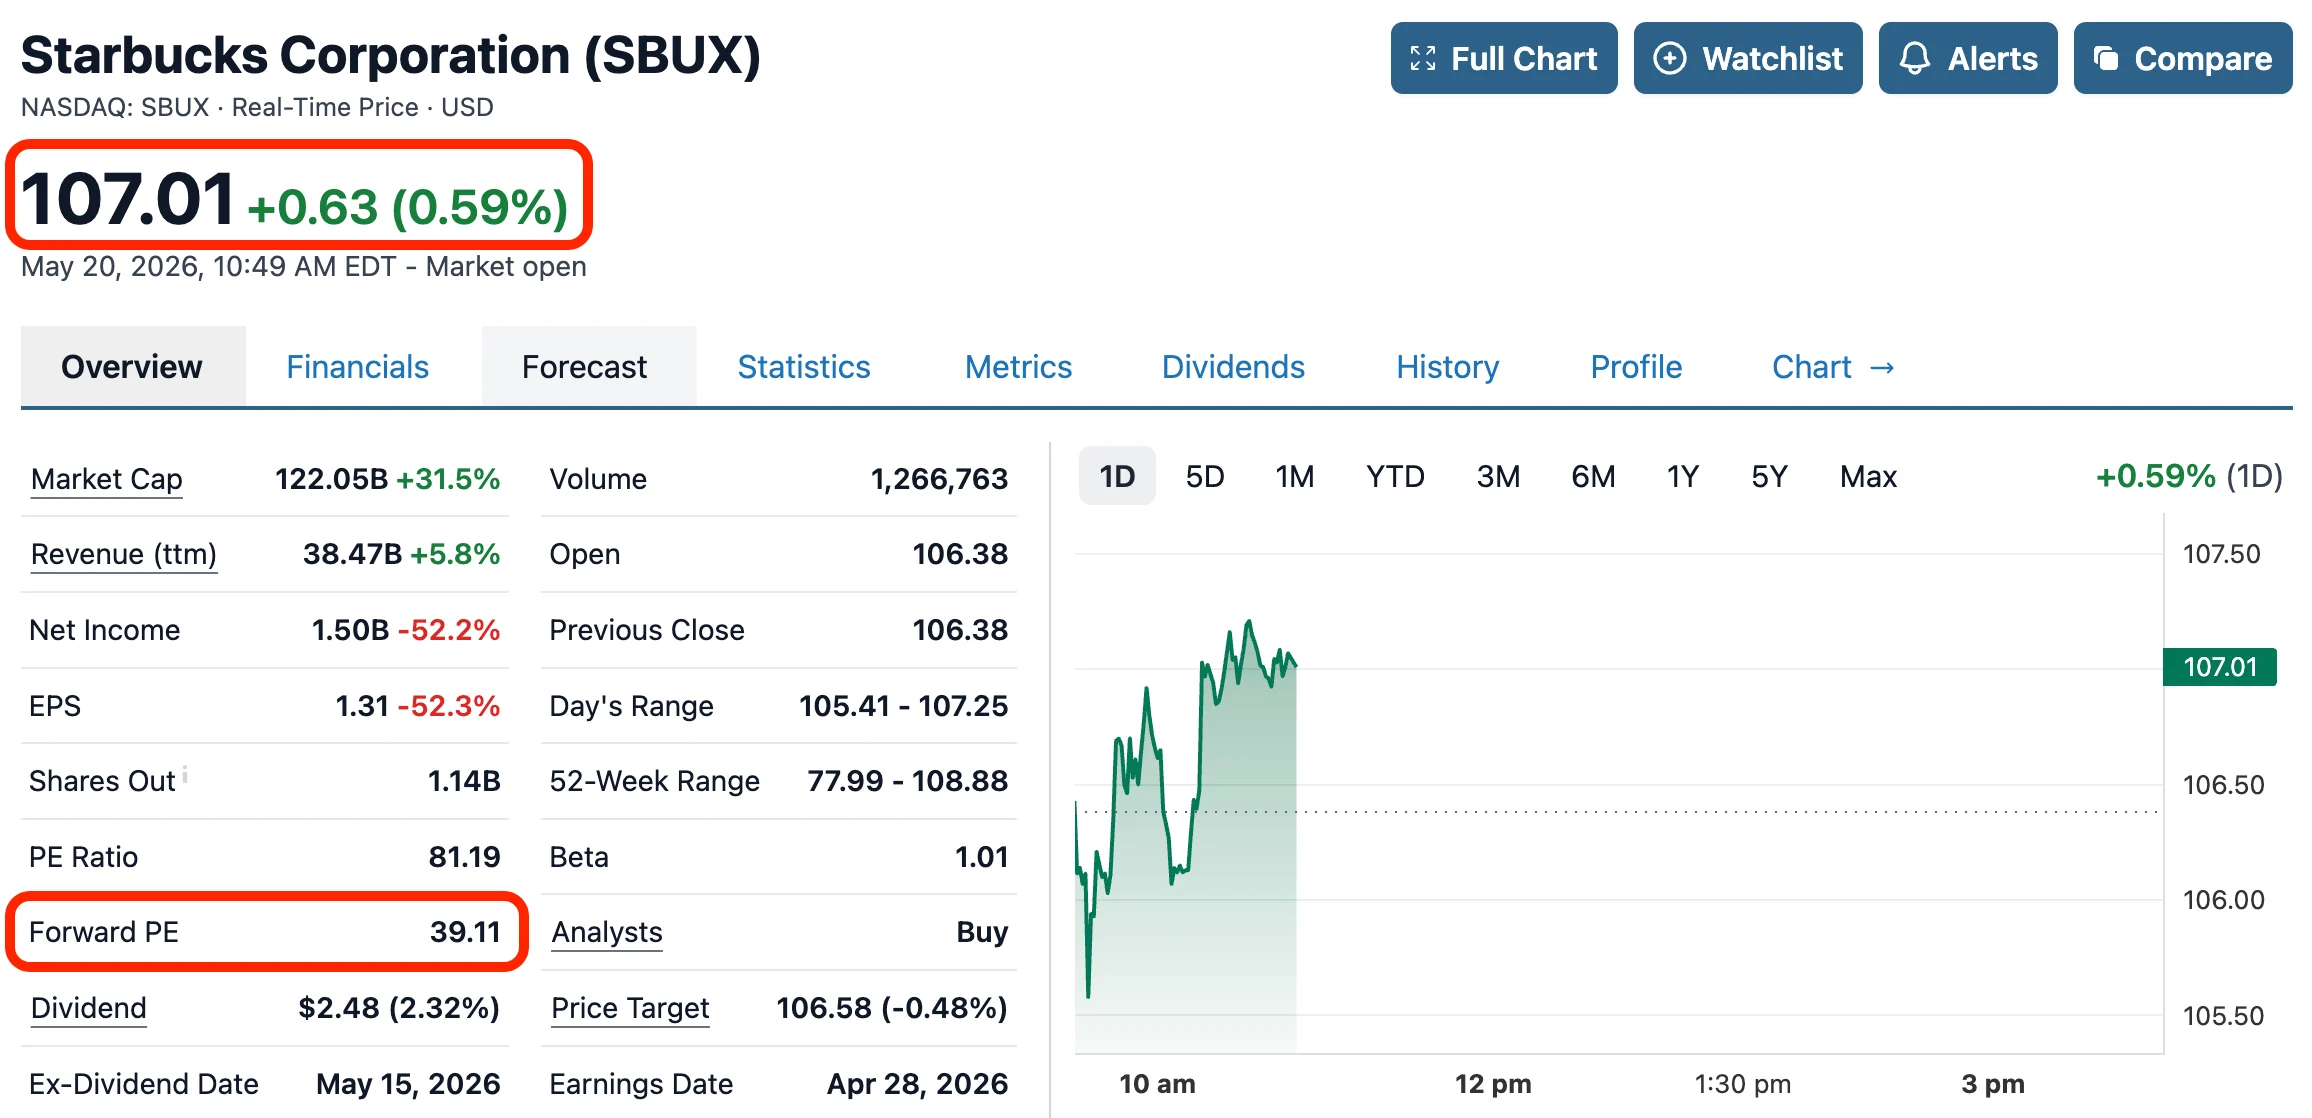
Below is a calculation of forward P/E for Starbucks (SBUX).
To find the inputs you'll need for the formula, you can use a financial data website like Stock Analysis to find the consensus earnings per share (EPS) for publicly traded companies.
Consensus forecasts are determined by averaging the numbers that individual analysts predict.
The chart below shows the consensus EPS for Starbucks, as of the time of this article's most recent update in May of 2026.
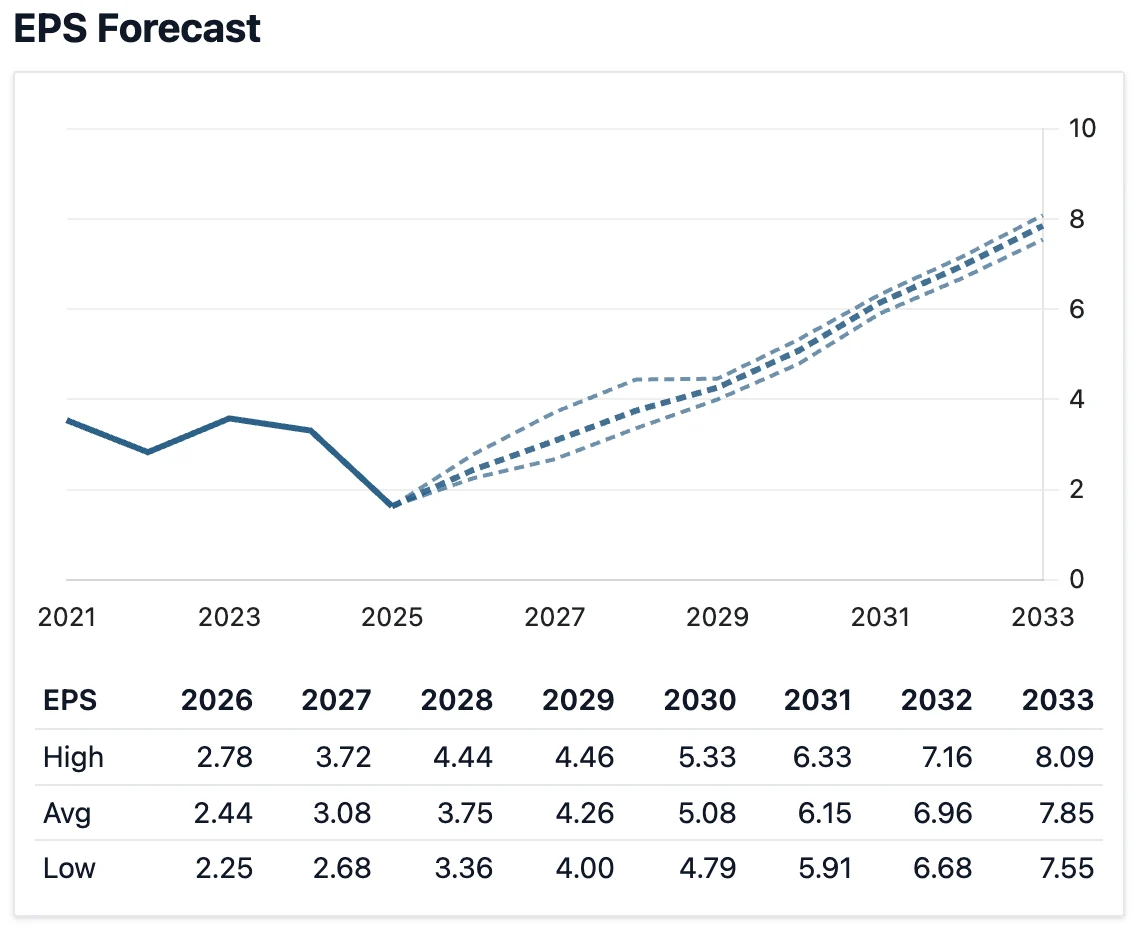
Source: Starbucks' Financial Forecast
The current share price, also in May of 2026, is $107.01. The forward P/E calculation for Starbucks can then be calculated like so:
Forward P/E = $107.01 / $2.44 = 43.86
Additionally, stock data websites like Stock Analysis can calculate forward P/E for you.
Note that depending on data inputs and how the consensus EPS is calculated, the exact forward P/E number may vary slightly, though it should be relatively similar across the board.
SummaryForward P/E is calculated by dividing the current share price by the estimated future earnings per share. You can either calculate forward P/E yourself or find it listed on financial data websites.
How to interpret and use forward P/E
There are several ways to use and interpret forward P/E, including comparing a company's forward P/E to its trailing P/E or looking at it in relation to peers or the industry.
You can also use forward P/E to analyze a company's expected future growth rate and assess the market as a whole.
Compare forward P/E to trailing P/E
To get a sense of what a company's forward P/E means, it's helpful to compare it to the historical, or trailing, P/E ratio. This is calculated as follows:
Price-to-earnings ratio: stock price / earnings per share
If the forward P/E is projected to be lower than the trailing P/E, analysts expect earnings to increase. If the forward P/E is projected to be higher, then earnings are expected to decrease.
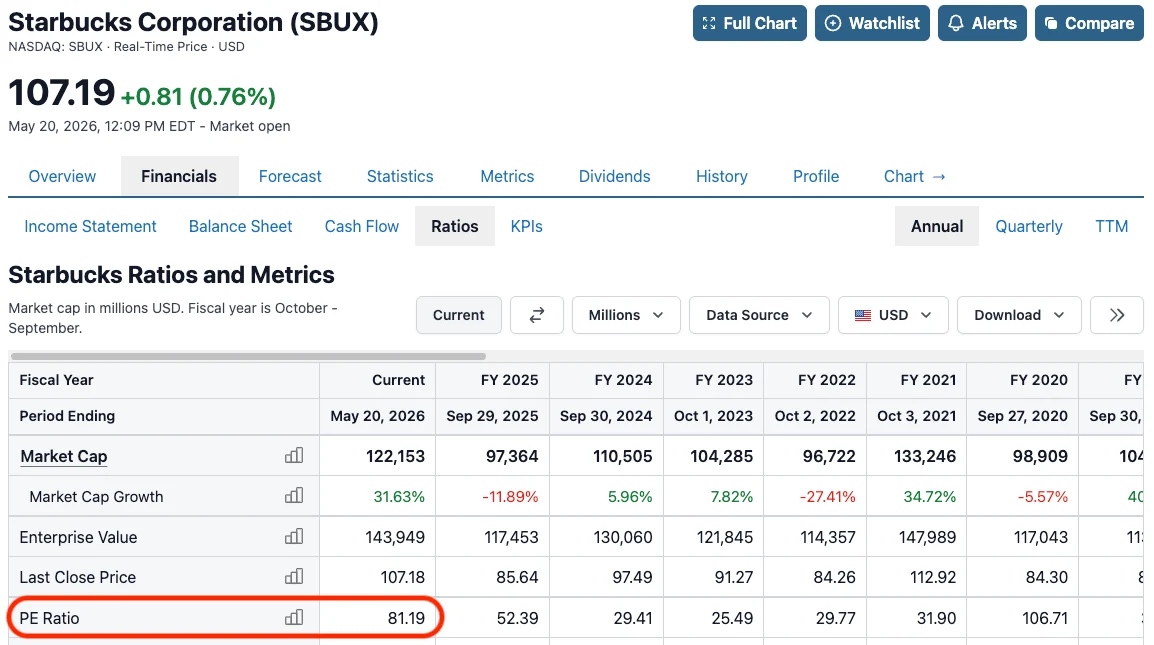
Starbucks' forward P/E is 43.86, while, as seen below, its trailing P/E is 81.19. This means earnings are expected to increase.
Compare to peers or the sector
You can also compare a company's forward P/E to peers or its sector.
For example, Starbucks belongs to the consumer discretionary sector. You could look up the forward P/E for the entire sector or look at historical averages (1).
However, this can be slightly tricky to interpret and it's worth looking more into why growth is or is not expected, compared to the industry average.
You can also make comparisons between peer companies, though it's important to remember that two companies with identical forecasted earnings can have different forward P/E numbers because the share prices will almost always be different.
Determine expected future growth
The forward P/E is reflective of expected growth rates and how much market participants are willing to pay for that growth.
Companies that demand higher P/E ratios have either higher expected earnings or growth rates, so people are willing to pay more for that growth.
However, this can be risky if that growth is interrupted.
The P/E ratio can also be high when companies have had a decline in earnings or are expecting major earnings declines, so there is quite a bit to consider when analyzing the numbers.
The PEG ratio, which is the P/E ratio divided by earnings growth over time, can also help in making this assessment.
Of note, value stocks traditionally have low P/E ratios.
Assess the overall market
Analysts can also use forward P/E to make a determination about the stock market as a whole.
For example, in 2022, the forward P/E of the S&P 500 fell below the 10-year average. This drop might suggest that, in general, people expected the growth of the S&P 500 to slow (1).
Conversely, this could also mean it's undervalued compared to historical averages.
Experts can also assess a specific company's forward P/E in relation to the market as a whole. For example, they could see how it compares to the median forward P/E of the market to get a sense of how expensive the company is in comparison.
It is then an analyst's job to determine why that difference exists, if it's justified, and whether or not there is any opportunity to capture.
SummaryForward P/E can be used and interpreted in several ways. You can compare a company's forward P/E to its trailing P/E, draw comparisons between peers, determine expected future growth rates, and consider the forward P/E of the market as a whole.
What is a “good” forward P/E?
Determining what number constitutes a “good” forward P/E is entirely subjective. There is no universally agreed number that is considered good or bad.
However, as noted above, investors can form an opinion of what they think is good or bad based on the P/E figures of the relevant sector or forward P/E compared to trailing P/E.
For example, in May of 2026, the median trailing P/E ratio for the S&P 500 based on data going back to before 1880 is 15.07, while the current trailing P/E ratio for the S&P 500 is 31.66 (2).
The fact that the historic median trailing P/E ratio is lower than the current figure might suggest that the valuation of the S&P 500 is still relatively high by past standards.
A good or bad forward P/E ratio is also highly dependent on the sector.
Data shows that the 10-year average forward 12-month P/E ratio for the consumer staples sector was 18.9 in 2022, whereas the same number for the financials sector was 12.9 (1).
SummaryA “good” forward P/E is dependent on several factors including the median P/E of the market, the average forward P/E of the appropriate sector, and the investor's general expectations about the company in question.
Comparing trailing P/E to forward P/E
As mentioned above, the other way to calculate P/E is the trailing P/E.
This version of the P/E ratio uses earnings per share (EPS) over the past 12 months. In most cases, the reported P/E ratio of a company is its trailing P/E figure.
The trailing P/E is more reliable than the forward P/E because it is calculated using real numbers rather than estimates. However, investors still need to be careful when assessing a company's trailing P/E because past performance offers no guarantee of future performance.
The trailing P/E can be particularly useful when analyzed alongside the forward P/E. For example, an investor can compare the two numbers and see which of the two is larger.
This comparison matters because a forward P/E ratio that is lower than the trailing P/E ratio might suggest that analysts expect the company's earnings to increase.
In contrast, a forward P/E ratio that is higher than the trailing P/E ratio might suggest that analysts expect the company's earnings to fall.
SummaryWhile the forward P/E ratio looks at future estimates, the trailing P/E ratio uses historical data. Trailing P/E is useful because it is based on actual figures, and it's often used alongside forward P/E to get a well-rounded view of a company.
Limitations of forward P/E
The very nature of forward P/E is also its greatest limitation.
Because P/E uses analysts' estimates, which can be wrong, the estimated future earnings per share can be greatly overestimated or underestimated.
Additionally, a company could wilfully underestimate its earnings to beat the consensus estimate P/E, making itself look unexpectedly good. Doing so will distort the forward P/E.
Forward P/E can also be inaccurate if a company reports positive earnings even while experiencing negative free cash flow. This means that the business is spending more than they are bringing in.
So while a highly useful metric, P/E should be used alongside other metrics, such as trailing P/E, to form a full view of a company's past, present, and future.
SummaryThe main limitation of the forward P/E calculation is that its value is highly dependent on the accuracy of the forecasted earnings per share, which are an estimate.
The takeaway
The forward price-to-earnings (P/E) ratio is a valuation metric that compares a stock's share price to its forecasted earnings per share.
However, interpreting this number requires context, and it's helpful to compare a company's forward P/E to those of its peers or sector.
Forward P/E is also often used alongside trailing P/E, which looks at past earnings.
Additionally, using forward P/E involves some risk because the company's real earnings may be much different than the estimated earnings used in the calculation.
Overall, forward P/E is a strong indicator of how the market is valuing a company, but it should always be used alongside other metrics for a more holistic overview.