Revenue Growth


Revenue growth is a term used to describe a company's increase in revenue over a period of time. It's usually measured quarter-over-quarter or year-over-year.
To calculate revenue growth, take the current period's revenue and subtract the previous period's revenue, and then divide by the previous period's revenue:
Revenue growth = (current period revenue – previous period revenue) / previous period revenue
Examining revenue growth over time can help identify trends and predict future performance.
Understanding revenue growth, how to measure it, and what it represents is important for any investor seeking to make an informed decision about a stock purchase.
What is revenue growth?

Revenue growth is a simple calculation that allows an investor to measure a company's increase in revenue compared to previous quarters or years.
It's used to evaluate growth trends in the business, predict future performance, and indicate the rate at which a company is increasing its revenue.
In finance, revenue is found at the top of the income statement, since this is the money a business earns from conducting normal business operations.
Note that the revenue figure only represents sale proceeds and does not include any expenses. High revenue, while positive, should not be the only metric used to evaluate performance.
For example, excessive costs can erode or eliminate the profit derived from revenue by the time all expenses are removed and the "bottom line" number is reached.
Therefore, it's important to look at the whole income statement.
SummaryRevenue growth reveals the rate at which a company is increasing the cash it generates from normal business operations. It can be compared to previous quarters or years.
How to calculate revenue growth
The revenue growth formula is:
Revenue growth = (current period revenue – previous period revenue) / previous period revenue
When calculating revenue growth, it's important to use a consistent time interval.
For example, revenue from one quarter should be compared to revenue from another quarter. Similarly, the revenue figure for one year should be compared to another year.
Sample calculation
As an example, consider a company that generated $50 million in revenue during the first quarter of the year, or January through March.
In the second quarter, April through June, that same company generated $62 million in revenue.
Therefore, the revenue growth calculation is:
Revenue growth = ($62,000,000 - $50,000,000) / $50,000,000 = 24%
Real-life example
The data below shows a real-life example of a revenue growth calculation for Netflix (NFLX), based on publicly available data taken from the company's quarterly earnings page.
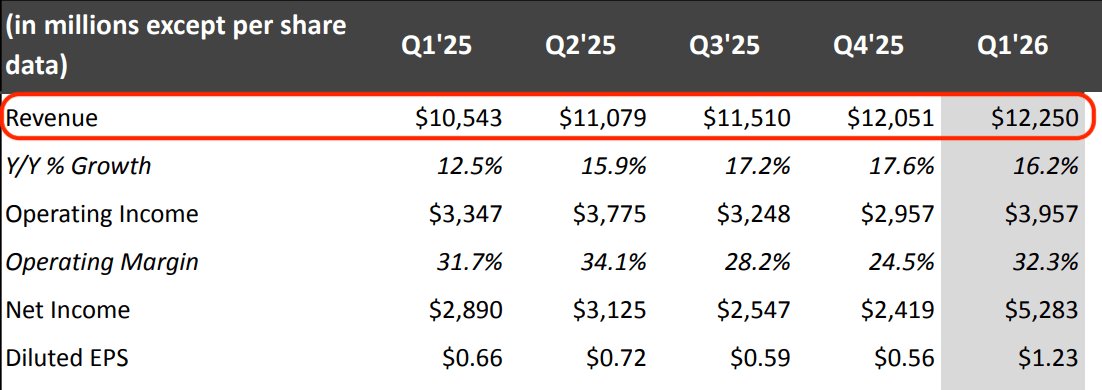
Source: Netflix Q1 2026 Shareholder Letter
Here, you can see the revenue figure for each quarter of the year, and the quarterly revenue growth can be calculated like so:
| Period | Calculation | Revenue growth |
| Q1 2025 to Q2 2025 | ($11,079,000 - $10,543,000) / $10,543,000 | 5.08% |
| Q2 2025 to Q3 2025 | ($11,510,000 - $11,079,000) / $11,079,000 | 3.89% |
| Q3 2025 to Q4 2025 | ($12,051,000 - $11,510,000) / $11,510,000 | 4.70% |
| Q4 2025 to Q1 2026 | ($12,250,000 - $12,051,000) / $12,051,000 | 1.65% |
In this calculation, you can see that Netflix's revenue grew from one quarter to the next.
However, the rate of growth has decreased from 5.08% down to 1.65%. This deceleration might suggest diminishing growth ahead.
SummaryTo calculate revenue growth, you need the revenue figure from the income statement for two consistent intervals of time, such as quarters or years. As more time periods are added, the revenue growth trend becomes more clear.
What is year-over-year revenue growth?
Year-over-year (YoY) revenue growth calculates the change in revenue over a one-year period.
This is different from year-to-date (YTD) measurements, which track changes in a figure from the first day of the current year to the current day of the current year.
Below is an example of a YoY revenue growth calculation for a company earning USD $15 million in revenue in Q2 of 2021 and $19 million in Q2 of 2026.
YOY revenue growth = ($19,000,000 - $15,000,000) / $15,000,000 = 26%
To calculate YoY growth, the period between the two figures cannot be more or less than one year.
SummaryYear-over-year (YoY) revenue growth compares revenue figures that are separated by exactly 12 months. Examining several YOY figures provides a long-term view of a company's revenue potential.
What is a good revenue growth rate?
What's classified as a “good” revenue growth rate varies by company and industry.
For example, some investors may choose to compare the revenue growth of a company to the expected revenue growth rate of that company's entire sector.
Consider an investor who is evaluating a company in the green and renewable energy sector in 2026.
They may decide to analyze expected revenue growth for the sector over the next 2 years, which is 13.01%, according to research compiled by NYU Stern School of Business (1).
Other sectors have lower revenue growth rate expectations. The publishing and newspapers sector is expected to experience a 1.01% revenue growth rate over the next 2 years, according to the same research.
Investors should also consider the median and the average growth rates for the entire S&P 500, in order to get a sense of growth across a broad collection of stocks in all sectors.
SummaryA good revenue growth rate depends on the comparative figure for the company's sector, as well as how the company's growth rate compares to the S&P 500.
Limitations to the revenue growth metric
Revenue growth is a widely used metric for assessing a company's potential. However, in certain cases, there can be drawbacks to using this metric.
For example, an early-stage startup may have enormous month-over-month revenue growth as demand surges for their new product or service. This figure is likely to drop as the company matures.
Therefore, an investor might be misled into thinking that these early figures are indicative of perpetual growth when, in fact, the revenue growth will likely level off over the long-term.
In scenarios like this, it can also be difficult to measure revenue growth in a meaningful way because a new company will have a limited history of revenue figures.
Seasonality can also play a role, especially in quarter-to-quarter figures.
In general, it's best practice to examine revenue growth over the long term whenever you can. Looking at revenue figures for just two or three quarters might not give you the whole picture.
SummaryRevenue growth measurements have limited value when the company is a young startup or when the analysis only covers a limited time frame.
Why does revenue growth matter to investors?
Revenue growth over the long-term indicates that a company is growing.
If a company is able to maintain this growth without letting costs get out of hand, then the shareholders are likely in a good position to see the value of their shares rise.
Research from McKinsey confirms that revenue growth influences total returns to shareholders. In fact, their analysis of more than 2,200 large global companies shows that revenue growth is a fundamental driver of value creation.
They conclude that “higher economic profit growth plus higher revenue growth generates higher returns to shareholders” (2).
While this research suggests that revenue growth has major implications for long-term share price appreciation, it is important to remember that revenue growth does not guarantee a rise in share price.
SummarySome research shows that revenue growth among large global companies drives both value creation and higher returns to shareholders.
The takeaway
Revenue growth is a quick and easy way to gauge a company's ability to increase revenue over a given period.
To calculate revenue growth, investors need a minimum of two revenue figures from two periods such as quarters or years.
The more periods used to calculate revenue growth, the more complete the picture of the company's performance will be.
Using a long time horizon also prevents the distortions that come from seasonality or from new startups with little performance data.
Additionally, it's important to know that revenue growth alone does not indicate strong performance — this metric must be used with other analytic tools to provide a fully dimensional picture of a company's value.