Dividend Payout Ratio


The dividend payout ratio is a metric that shows how much of a company's net income goes to paying dividends.
It can be calculated in three ways: (1) by dividing dividends per share by earnings per share, (2) by dividing total dividends by net income, or (3) by calculating the retention ratio and then subtracting it from the number 1, like so:
-
Dividend payout ratio = dividends per share / earnings per share
-
Dividend payout ratio = total dividends / net income
-
Dividend payout ratio = 1 - retention ratio ((net income - total dividends) / net income)
The dividend payout ratio is an excellent way to evaluate dividend sustainability, long-term trends, and see how similar companies compare.
It's also known as the payout ratio.
Below is a detailed guide to the dividend payout ratio, including how it's used, why it matters, and how to calculate it.
What is the dividend payout ratio?

The dividend payout ratio is a metric that represents how much a company pays in dividends relative to its net income.
It's closely related to the dividend yield, which represents the ratio of dividends paid relative to stock price. But while dividend yield provides insights into market price, the payout ratio provides insights into profitability and cash flow.
When examining a company's long-term trends and dividend sustainability, the dividend payout ratio is often considered a better indicator than the dividend yield.
You can also use the dividend payout ratio when comparing similar companies.
Of note, companies in older, established, steady sectors with stable cash flows will likely have higher dividend payout ratios than those in younger, more volatile, fast-growing sectors.
SummaryThe dividend payout ratio shows you how much of a company's net income is paid out via dividends. It's highly useful when comparing companies and evaluating dividend trends or sustainability.
How to calculate the dividend payout ratio
There are three formulas you can use to calculate the dividend payout ratio.
-
Dividend payout ratio = dividends per share / earnings per share
-
Dividend payout ratio = total dividends / net income
-
Dividend payout ratio = 1 - retention ratio ((net income - total dividends) / net income)
The items you'll need to calculate the dividend payout ratio are located on the company's cash flow and income statements.
Sometimes, companies will also simplify things and list the per-share inputs needed on their income statements or key financial highlights.
SummaryYou can calculate the dividend payout ratio in three ways using information located on a company's cash flow and income statements. The simplest way is to divide dividends per share by earnings per share.
Example calculations
Below is a real-life example of all three calculations using the energy giant Chevron (CVX) and its 10-K statement for the fiscal year 2024.
Formula 1
Oil and gas companies are traditionally some of the strongest dividend payers, and Chevron is no exception. Chevron makes calculating its dividend payout ratio easy by including the per-share data needed in its key financial highlights.
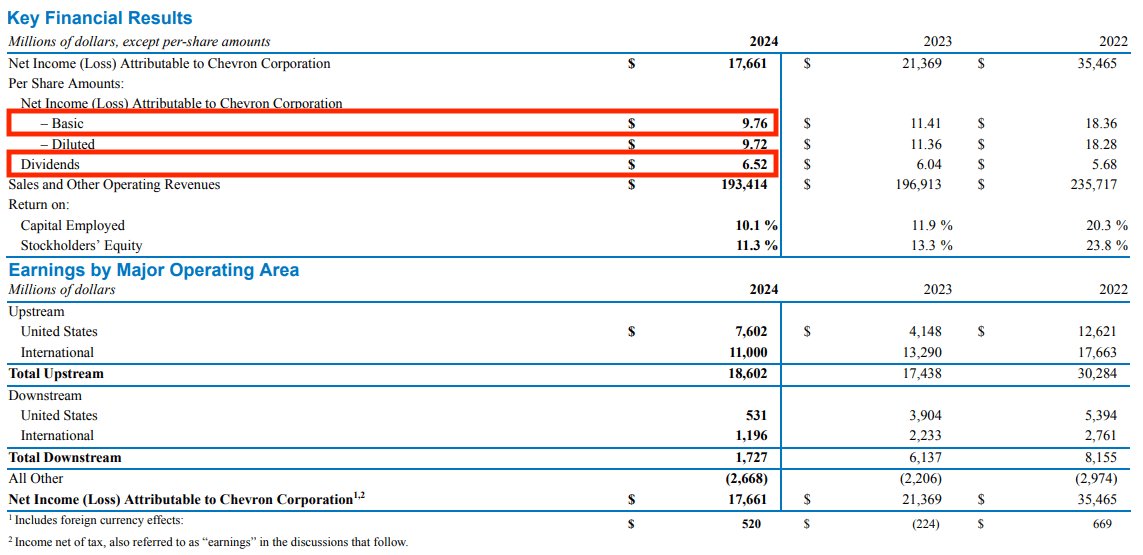
Source: Chevron's 10-K
For 2024, Chevron paid $6.52 in dividends per share and had a basic earnings per share of $9.76. So you can calculate the dividend payout ratio like so:
Dividends per share / earnings per share = dividend payout ratio
You can break this into two steps:
- $6.52 / $9.76 = 0.6680
- 0.6680 x 100 = 66.80%
Formula 2
You can use Chevron's cash flow statement from its 2024 10-K to calculate the dividend payout ratio using the second formula.
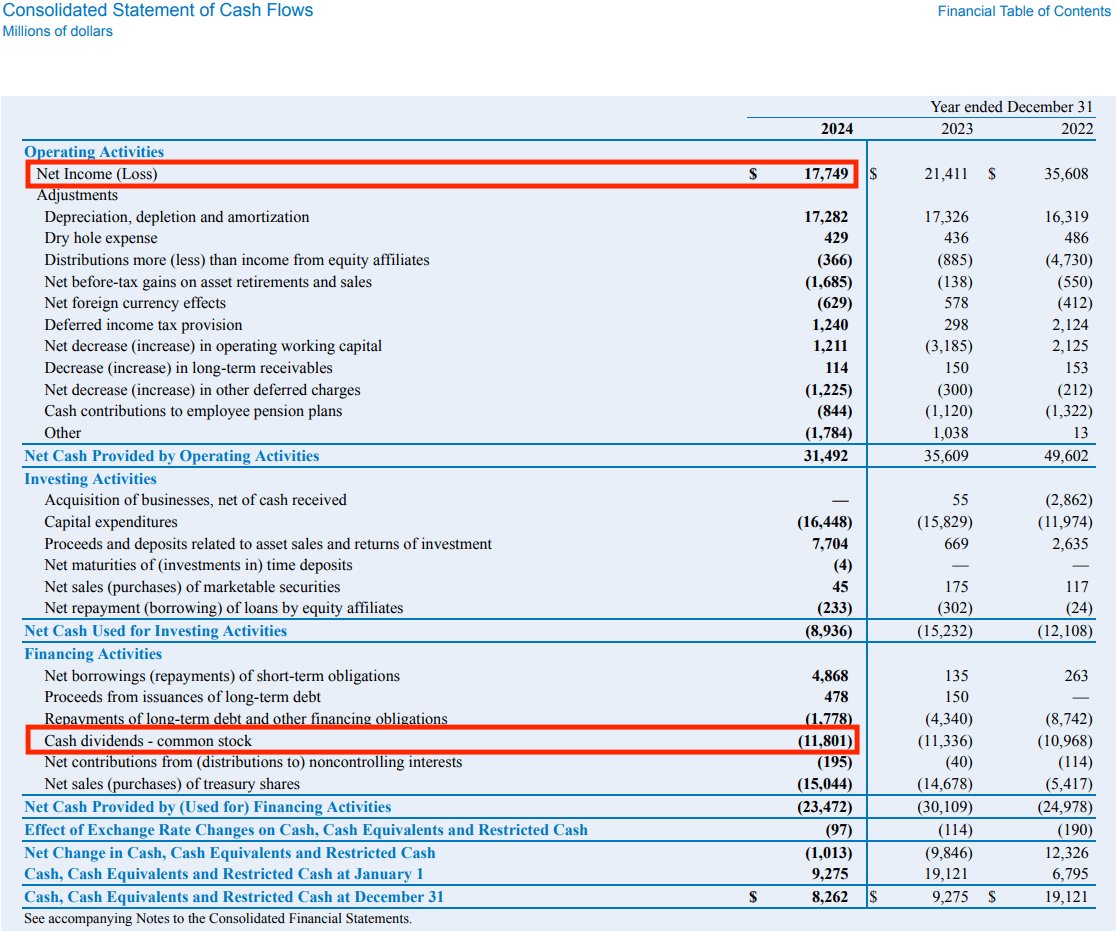
Source: Chevron's 10-K
Note that there may be slight differences compared to the first formula's calculation due to rounding and/or the exclusion of preferred shares, as only common shares are accounted for.
Here is the formula:
Total dividends / net income = dividend payout ratio
You can do this in two steps, like so:
- $11,801 / $17,749 = 0.6649
- 0.6649 x 100 = 66.49%
Formula 3
As is the case with the second formula, you can also use the cash flow statement to calculate the dividend payout ratio with the third formula.
The same note about slight differences applies here as well.
Here's the formula:
1 - retention ratio (net income - total dividends / net income) = dividend payout ratio
And here are the steps:
- ($17,749 - $11,801) / ($17,749) = .3351
- 1 - .3351 = 0.6649
- 0.6649 x 100 = 66.49%
SummaryYou can calculate the dividend payout ratio in several ways for a company, though due to the inputs used, the results may vary slightly.
How the dividend payout ratio is used
As noted above, dividend payout ratios vary between companies and industries, depending on maturity and other factors.
However, generally speaking, the dividend payout ratio has the following uses.
1. Shows the amount of profit paid back to shareholders
Investors and analysts use the dividend payout ratio to determine the proportion of a company's profits that are paid back to shareholders.
2. Reveals dividend sustainability
The payout ratio also helps to determine a dividend's sustainability, as companies are generally reluctant to cut dividends.
When a company slashes its dividend payout, this can make management look bad, raise concerns for investors, and cause the stock price to drop.
It's always in a company's best interests to keep its dividend payout ratio stable or improve it, even during a poor performance year.
BCE Inc. (BCE) is a recent example.
A long-time popular stock for dividend investors, it slashed its dividends on May 8, 2025, in order to reinvest more cash into the business amid price competition and economic difficulties. For all of 2025, the stock price only gained 2.6% (1).
3. Provides insights into long-term trends
Analyzing a company's dividend payout ratio over time indicates whether the company is healthy and maturing or paying out an unsustainable dividend.
4. Can be used to compare similar companies
Dividend payout ratios can be used to compare companies, though keep in mind that dividend payouts vary by industry and company maturity.
Therefore, the ratio should only be used to compare similar companies.
SummaryDividend payout ratios can vary between companies and industries. However, in general, this ratio is very useful when analyzing how much of a company's profit is distributed to shareholders, assessing trends, and making comparisons.
Limitations of the dividend payout ratio
Although the dividend payout ratio is a fundamental metric, it does have several limitations.
- Does not consider market price: The dividend payout ratio considers a company's cash flow and profitability, yet does not consider its stock price. For that, you would need the dividend yield. These two metrics provide useful but different insights.
- May not provide a complete picture: The dividend payout ratio does not always provide a comprehensive picture of how a company distributes value to its shareholders. For example, it does not incorporate share buybacks.
- Dividends vary by industry: Lastly, dividends vary by industry. In fact, some high-growth industries may not even pay dividends. This is why making these comparisons is only valuable when comparing peers to peers.
SummaryThe dividend payout ratio has three main limitations: it does not consider market price, it may not provide a complete picture of how value is distributed, and dividends are industry specific.
What is a “good” dividend payout ratio?
In short, this depends on a company's industry and maturity.
Companies in older, established, steady sectors with stable cash flows will likely have higher dividend payout ratios than those in younger, volatile, fast-growing sectors.
More mature companies will also probably be less interested in reinvesting money into growing the business and more focused on distributing a consistent and generous dividend to shareholders.
For instance, insurance company Proctor & Gamble (PG) has a payout ratio of 61.8%, while tech company Apple (AAPL) has a payout ratio of 13.8%.
Can a dividend ratio be too high?
A higher dividend payout ratio isn't always a good thing.
For example, a company with too high a dividend payout ratio or a spiking dividend payout ratio may have an unsustainable dividend and stagnant growth.
Additionally, dividend reductions are viewed negatively in the market and can lead to stock prices dropping (2).
Can a dividend ratio be too low?
A low dividend payout ratio can sometimes indicate weak or unstable cash flows.
However, it's not always a bad thing. In fact, some high-growth companies may pay no dividends because they prefer to reinvest their profits in the business for future growth.
For this reason, investors focused on growth stocks may prefer a lower payout ratio.
SummaryA “good” dividend payout ratio depends on a company's industry and maturity. However, if a payout ratio is too high, it might not be sustainable. A low ratio could be cause for concern or could signal that the company is investing in itself.
The takeaway
The dividend payout ratio is a vital metric for value and growth investors alike.
This figure not only shows how much of a company's income is distributed to investors via dividends — it also shows how much money a company is reinvesting in itself, how sustainable the dividend is, and dividend payout trends over time.
Some investors like to see a company with a higher ratio, indicating the company is mature and pays a higher proportion of its profits to shareholders.
On the other hand, some investors may want to see a company with a lower ratio, indicating the company is growing and reinvesting in its business.
Often, this depends on the industry and company.
The dividend payout ratio reveals a lot about a company's present and future situation. To interpret it, you just have to know how to look at it as well as what your priorities are as an investor.