Free Cash Flow per Share


Free cash flow (FCF) per share shows how much cash a company has left after funding its core business and maintaining its capital assets, calculated per share of stock.
FCF per share can be calculated by dividing FCF by shares outstanding, like so:
Free cash flow per share = free cash flow / number of shares outstanding
FCF per share gives insights into profitability, providing an idea of how much flexibility the company has to do things like reward stakeholders, reduce debt, or invest in growth.
FCF per share is sometimes confused with earnings per share, although these two metrics can end up being very different since they use different accounting methods.
Below is a guide to FCF per share, including what it is and how to calculate it.
What is free cash flow per share?

Free cash flow, or FCF, is a metric that tells you how efficiently a company is generating cash from its business operations.
The calculation takes into account both the day-to-day running of core operations as well as any capital investments that need to be made in order to keep the business running as usual — such as new machinery or technology.
In addition to replacing assets, reinvesting in the business can also help a company stay ahead of the competition and maintain its market share.
Thus, cash flow can only be considered “free” from the business's core functions if these investments have already been deducted.
The remaining cash flow is then available for the company's directors to allocate toward other objectives. This could be rewarding shareholders, reducing debt, or investing in growth.
Free cash flow per share takes free cash flow and divides it by the number of outstanding shares in the company, effectively showing how much there is per share.
It's valuable when comparing one company to another, which becomes useful when considering two companies' share prices.
You can also monitor FCF per share trends over time, as if the number is going up, so is the company's ability to generate revenue for shareholders.
SummaryFree cash flow is the net cash a company has left after paying for running its core business operations and maintaining its capital assets. Free cash flow per share is the free cash flow number divided by the number of outstanding shares in the company.
How is free cash flow per share calculated?
Free cash flow per share is calculated via the following formula:
Free cash flow per share = free cash flow / number of shares outstanding
However, first you'll need to calculate free cash flow. FCF can be calculated in three ways, depending on what information you have available. The three methods are:
- Operating cash flow
- Sales revenue
- Net operating profit
The most common way is to use operating cash flow, as it is simple to do and the necessary information can easily be found on the cash flow statement.
Once you've calculated FCF, divide by shares outstanding to calculate FCF per share.
It's better to use the diluted number of shares, as this takes into account any convertibles or other shares that will benefit from the FCF.
Below are the formulas for all three methods.
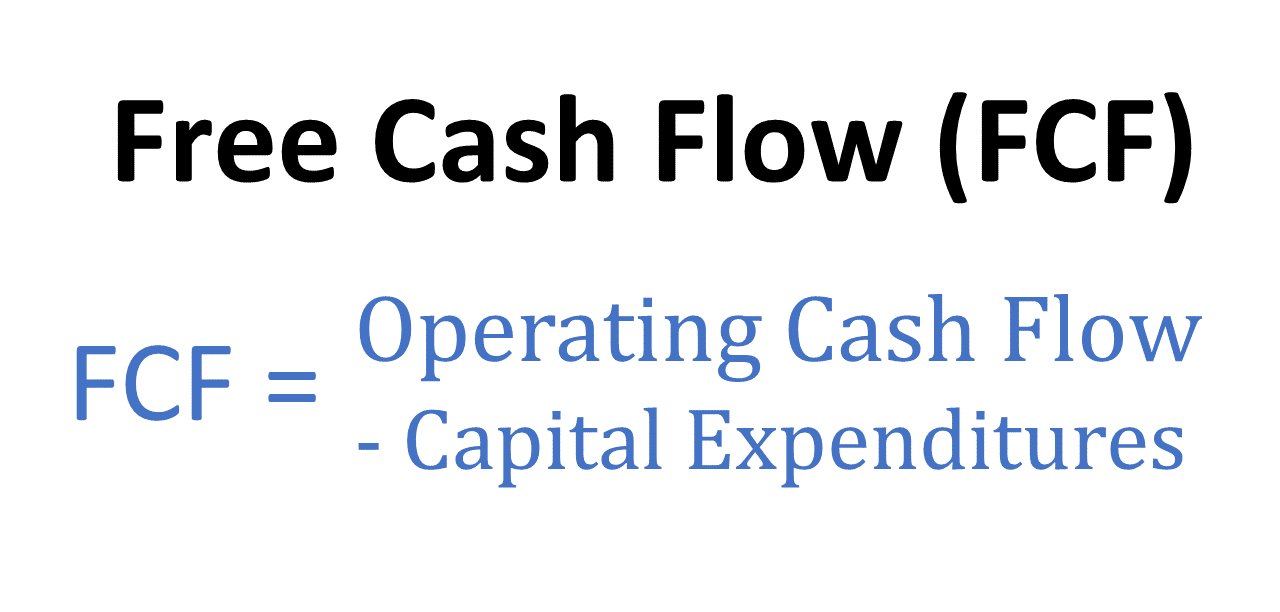
1. The operating cash flow method
The operating cash flow formula uses inputs easily found on the cash flow statement, making it simple and quick to use. Here is the formula:
FCF = operating cash flow - capital expenditure
Operating cash flow is located on the cash flow statement and is already adjusted to account for non-cash expenses and changes in working capital. Note that it can also be called operating cash or net cash from operating activities.
Capital expenditure can also be listed in different ways, including capital spending and acquisition expenses or purchases of property, plant, and equipment (PP&E).
To calculate FCF per share, you then divide FCF by the number of outstanding shares.
2. The sales revenue method
The formula starts with the revenue generated and then subtracts the costs that go into generating that revenue. It can be tricky to calculate, as you need quite a bit of information:
FCF = sales revenue - (operating costs + taxes) - required investments in operating capital
Here are the additional formulas you'll need to make this calculation:
-
Required investments in operating capital = year 1 total net operating capital - year 2 total net operating capital
-
Total net operating capital = net operating working capital + net plant, property, and equipment (operating long-term assets)
-
Net operating working capital = operating current assets - operating current liabilities
-
Operating current assets = cash + accounts receivables + inventory
-
Operating current liabilities = accounts payable + accruals
As you can see, this method is more complicated than the first method because you need many inputs, which come from both the income statement and the balance sheet.
Note that any investment into improving the business would not be included in this calculation, as it would come out of the FCF once it was calculated.
To calculate FCF per share, simply divide FCF by the number of outstanding shares.
3. The net operating profit method
This method is similar to using sales revenue, except that operating income is used instead:
FCF = net operating profit after taxes - net investment in operating capital
And here are the additional formulas you'll need to make this calculation:
-
Net operating profit after taxes = operating income x (1 - tax rate)
-
Operating income = gross profits - operating expenses
And, as above, to calculate FCF per share you then divide the FCF calculation by the number of outstanding shares.
SummaryTo calculate FCF per share, divide FCF by the number of outstanding shares. There are three methods to calculate FCF: operating cash flow, sales revenue, and net operating profit. The simplest and most common way is the operating cash flow method.
How to find free cash flow per share
Free cash flow is a calculated number, and as such, not necessarily provided by companies.
Depending on which calculation method you use, the information you'll need is located on a company's income statement, cash flow statement, and balance sheet.
You can also use sites like Stock Analysis to list FCF and FCF per share for you. For example, below is the cash flow statement for Micron Technology.
If you wanted to calculate FCF or FCF per share yourself via the first formula, the operating cash flow and capital expenditure numbers are listed there.
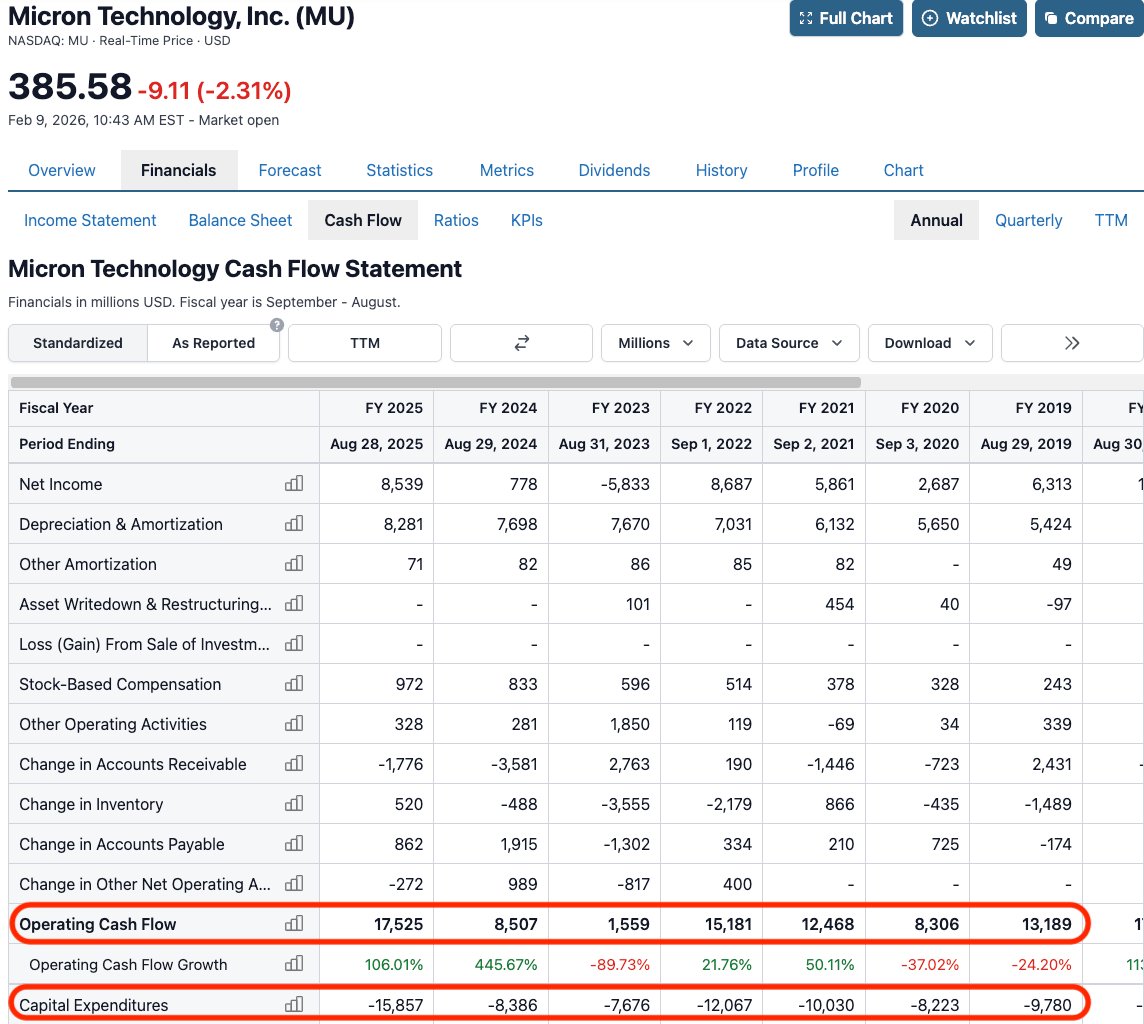
Source: Micron Technology's Cash Flow Statement
Additionally, FCF and FCF per share are already listed near the bottom:
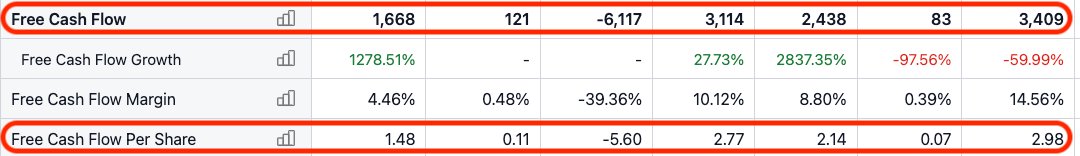
Source: Micron Technology's Cash Flow Statement
SummaryFCF and FCF per share are calculated metrics not necessarily provided by companies. However, you can find the information you need on the income statement, cash flow statement, and balance sheet. Stock data websites also list these metrics for you.
Why is FCF per share useful?
FCF per share helps investors understand how profitable a company is on a per-share basis. It's also commonly used when valuing a company.
Another popular metric for this is earnings per share (EPS), though these two metrics use different accounting methods — FCF per share looks at actual, not accrued, cash.
EPS uses information provided on the income statement and spreads the cost of capital expenditures over the years of their useful life. FCF per share, on the other hand, looks at cash flow over a specific accounting period.
Since FCF per share shows the cash going in and out of the business during a set time, it gives companies choices about how to manage solvency and liquidity needs.
This may be by keeping shareholders happy with a higher dividend. Shareholders could also be pleased if the company pays down debt or invests in future growth.
For the discerning investor, understanding the FCF position of the company allows them to get a better idea of how the company is set up for the future.
Additionally, an increasing FCF per share is a good sign.
SummaryFree cash flow per share is a measure of profitability. It is often used alongside earnings per share (EPS), as they offer different perspectives. FCF per share ultimately provides insights into how a company is setting itself up for future success.
FCF per share vs EPS: how they work together
FCF per share and earnings per share (EPS) are both measures of profitability.
However, they offer different perspectives and use different accounting methods.
FCF per share excludes the non-cash expenses of the income statement. Furthermore, it includes costs associated with buying equipment and assets, as well as changes in working capital.
Unlike EPS, FCF per share shows you what the cash flow in and out of the business looks like instead of the way items are reported for accounting purposes.
As an example, if a company buys a new property, it will be taken into account in the FCF per share number, which would be significantly reduced or even negative.
On the other hand, EPS would take this purchase into account very differently, ignoring it in the year of purchase and then deducting the amortization costs over the coming years.
Below are a few more examples of how FCF per share can shed light on business activities in ways that other metrics can't, since it includes changes to working capital:
- If a vendor was demanding faster payments, there could be a decrease in accounts payable due to the outflow to the vendor.
- If the company is collecting cash from customers more quickly, then accounts receivable, the inflow from customers to the company, would decrease.
- If there were more unsold products, causing inventory to expand, which is an outflow.
Generally, investors will look at both EPS and FCF per share to get the clearest idea of how things are going at a company.
Of note, one downside of FCF per share is that it can be significantly affected by large capital investments.
SummaryFCF per share and EPS both measure profitability, though they offer complementary insights into operations and are calculated via different accounting methods.
Types of free cash flow: FCFF and FCFE
Analysts and investors who want to look in more depth at a company's future potential may want to consider the company's possible choices when it comes to capital structure.
To do this, they will sometimes use free cash flow for the firm and free cash flow to equity, since these are adjusted for interest payments and borrowing.
Free cash flow to the firm (FCFF)
Free cash flow to the firm, or FCFF, is sometimes called unlevered free cash flow since it doesn't account for leverage, or debt. Here is the formula:
FCFF = operating cash flow + (interest expense x (1 - tax rate)) - capital expenditures
It's an important number in determining stock value, as a positive number shows there is cash left after paying for these expenses.
Free cash flow to equity (FCFE)
Free cash flow to equity, or FCFE, includes the effects of debt. This is why it's sometimes called levered FCF. Here is the formula:
FCFE = operating cash flow - capital expenditures + net debt issued (repaid)
This is useful because debt has priority in the capital structure — by law, those owed debts would be paid ahead of equity shareholders. Therefore, this ratio helps equity shareholders understand how the free cash would look once the debt shareholders were paid.
SummaryFree cash flow to the firm is the money a company has before paying its financial requirements, while free cash flow to equity is the money left after those obligations are paid. Both are types of free cash flow.
The takeaway
Cash flow is a major focus when analyzing the value of a company, as the business's current value is tied to projected future cash flow.
Free cash flow shows how much cash a company has left after funding its core operations and maintaining its capital assets. FCF per share is this number, divided by shares.
FCF per share provides a look into the actual cash flowing in and out of the business, and a strong FCF is generally a sign of a healthy business.
FCF can be used by the company to reward investors with dividends, pay down debt, or invest in future growth — all of which are likely to benefit the company in future years.
FCF per share is often used alongside earnings per share since both metrics help investors understand how a business is running its operations.
However, FCF uses actual cash flow at the time payments were made, while EPS uses accruals, which allows the company to spread capital costs across the lifespan of assets.
This means FCF per share and EPS can look very different at times, especially in years when companies are making large one-off investments.
Overall, both are useful metrics that provide different insights into a company.