Net Profit Margin


The net profit margin is a measure of profitability that shows the amount of net income a company generates as a percent of revenue.
It's calculated by taking net profit and dividing it by revenue, then multiplying by 100, like so:
Net profit margin = (net profit / revenue) x 100
This measurement provides an overall picture of a company's profitability, and investors can use it to see how well a company is generating a profit compared to costs.
Net profit margin is also known as net margin, net profit margin ratio, and profit margin.
What is the net profit margin?

Net profit margin is a metric that looks at net income in proportion to revenue.
It's more revealing than looking at revenue alone, which doesn't account for costs. Because net profit does account for costs, the net profit margin formula shows you what's left over.
Investors can use this percentage to quickly see how effective a company is at generating profit while also maintaining control over costs.
Simply put, you can think of the net profit margin as the net profit a company earns per dollar of revenue.
A higher number usually indicates that the company is effectively managing costs, though it's important to keep the larger context in mind. For example, some industries have higher profit margins than others, and external factors, like inflation, play a role as well.
Since the net profit margin is represented as a percentage, it's easy to use it to compare the profitability of peers. Analysts also frequently use net profit margin to assess a company's valuation or when constructing financial models.
That said, it's important to remember that even when comparing percentages between similar businesses, an investor must account for differences not reflected in the numbers.
SummaryThe net profit margin examines net income in proportion to revenue. Because costs are accounted for, it reveals how well a company is generating profits compared to costs.
How to calculate the net profit margin
To calculate the net profit margin, you simply divide net profit by revenue and then multiply the result by 100 to generate a percentage.
The net profit margin formula is:
Net profit margin = (net profit / revenue) x 100
Both net profit and revenue can be found on a company's income statement.
You can find the income statement on a company's investor relations page or via the U.S. Securities and Exchange Commission (SEC), which provides the financial information of all publicly traded companies.
Alternatively, you can find this data on websites like Stock Analysis.
The net profit formula
For reference, it's useful to know what all goes into the net profit figure. Net profit is calculated by subtracting all of the company's expenses from total revenue.
The calculation for net profit is:
Net profit = revenue - cost of goods sold - expenses - taxes - interest on debt
However, you shouldn't need to calculate this figure yourself as it's also listed on the income statement or can be easily found on stock data websites.
SummaryThe net profit margin can be calculated using the net profit and the revenue of a company, both of which are found on the income statement.
Example net profit margin calculation
The following example shows how to calculate the net profit margin for Nike (NKE). The income statement used here is for the year that ended on May 31, 2025.
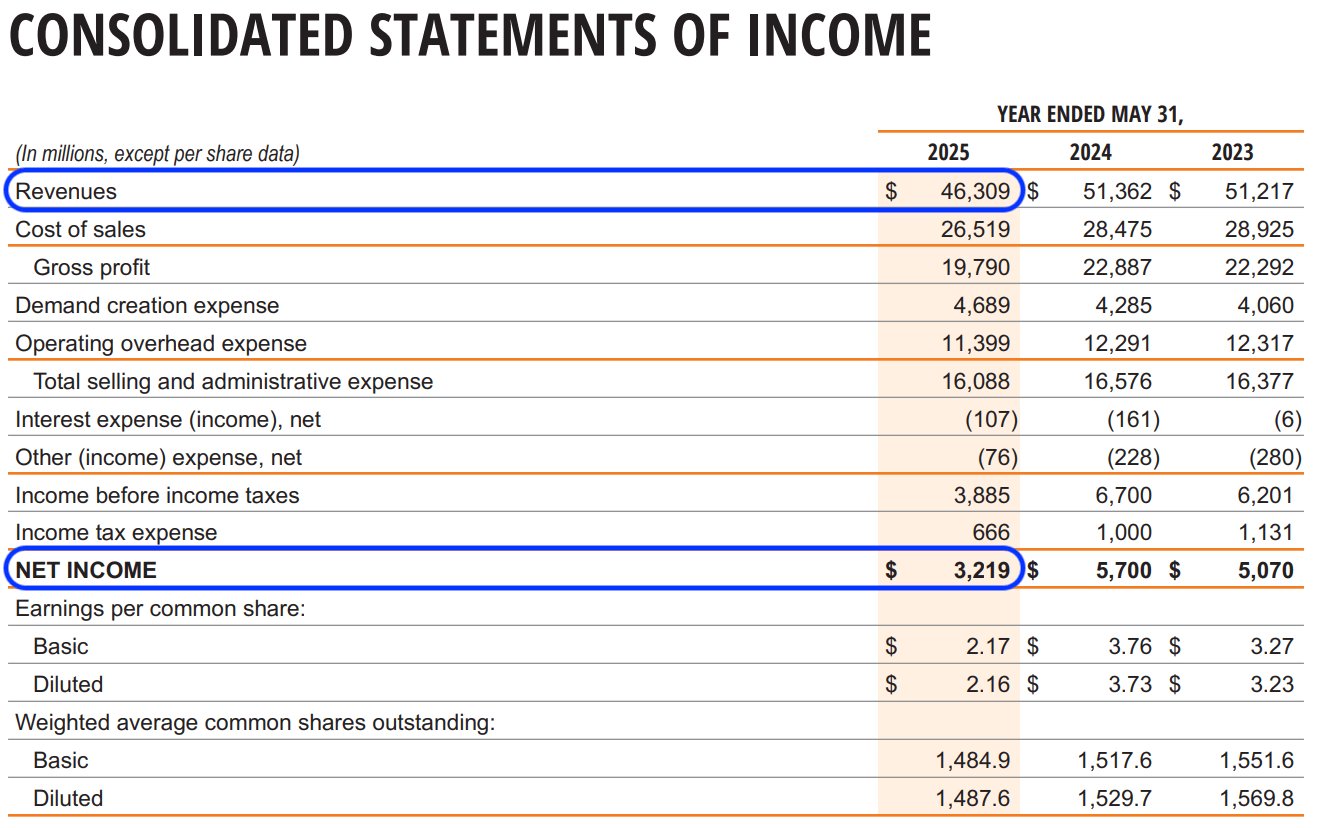
Source: Nike's 10-K
Nike's net income (in millions) was USD $3,219, while its revenue (in millions) was $46,309.
With those numbers, you can calculate the net profit margin like so:
Net profit margin = ($3,219 / $46,309) x 100 = 6.95%
This number means that Nike earned a net profit of 6.95% per dollar of revenue.
Put another way, a net profit margin of 7% means that for every dollar generated by Nike in sales, the company kept $0.07 as profit.
To put this in context, it's helpful to compare figures to competitors and industry averages.
Additionally, to make a complete comparison between two companies, an investor should also consider the context of the company within its industry. This means looking at things like company age, size, market penetration, product popularity, brand goodwill, etc.
SummaryThe net profit margin is quick and easy to calculate. However, this number alone is not enough to judge the value of a business — it should be one factor in a larger analysis.
What is a “good” net profit margin?
There's no simple answer to this question, as, in short, it varies a lot by industry. Net profit margin should also always be considered one component of a larger financial analysis.
Rather than focusing on a “good” number, it's better to understand how to interpret net profit margin. To start, it's helpful to know the average for the company's sector or industry.
Data from the NYU Stern School of Business shows that the average net profit margin for the shoe industry is 6.27% in 2026, which means that Nike is in line with the market (1).
Of note, the average net profit margin can vary considerably by industry, as seen by the following examples:
- Building materials: 7.42%
- Food wholesalers: 1.17%
- Household products: 11.68%
- Semiconductor: 30.45%
- Transportation: 8.23%
- Utility (general): 14.18%
You can see the full list here.
Interestingly, the highest average net profit margin in this data set is the semiconductor industry, at 30.45%, while the lowest is renewable energy, at -10.83%.
A negative net profit margin shows that a company, or in this case an industry, was not profitable for the period analyzed.
However, like any other financial measurement, the net profit margin alone should not be the only metric used to assess a company's financial health. For instance, a number that is considered strong in one industry may be considered low in another.
Even a comparison of two companies within the same industry can be misleading at times. For example, consider two businesses, one with a net profit margin of 9% and the other with a net profit margin of 8%. At first glance, the first company looks better.
However, further investigation might show that the second company has a greater cash flow and more property, plant, and equipment (PP&E) than the first company.
As a result, the company has greater depreciation expenses, reducing net income despite the impressive cash flow.
In this scenario, the net profit margin doesn't adequately reflect the complete picture.
Additionally, net profit margin can be misleading if a company decides to boost profits in the short term by reducing long-term expenses. As a result, net profit margin may look high, but only for a relatively brief period of time.
SummaryTo interpret whether a net profit margin figure is strong or poor, it's helpful to compare it to peers or industry averages. It's also important to conduct a broader financial analysis.
Net profit margin vs gross profit margin
Both gross profit margin and net profit margin are profitability ratios, but because they account for different items, they reveal different insights about a business.
The gross profit margin shows the amount of money remaining from revenue after accounting for the cost of goods sold (COGS), which are the expenses and materials used to generate products.
The calculation for gross profit margin is:
Gross profit margin = (net sales - COGS) / net sales
The resulting number is then multiplied by 100 to generate a percentage.
As a measure of profitability, the net profit margin is more complete because it accounts for all business expenses, not just COGS.
However, the gross profit margin is also important to investors because an increase over time means a company is becoming more efficient and bringing in more revenue per product sold.
Generally speaking, the gross profit margin reveals the profitability of specific items, while net profit margin is more focused on the bigger picture of running the business.
Using the above income statement, you can calculate Nike's gross profit margin to compare these metrics. Nike's net sales or revenue (in millions) was USD $46,309. Their cost of sales or cost of goods sold (in millions) was USD $26,519. Therefore, Nike's gross profit margin is:
- ($46,309 - $26,519) / $46,309 = 0.4273
- 0.4273 x 100 = 42.73%
The average gross profit margin, or simply gross margin, for the shoe industry is 43.88%, which suggests that Nike is competitive among its peers.
SummaryGross profit margin and net profit margin are both profitability ratios that analyze different aspects of a company's business. Gross profit margin accounts for COGS, while net profit margin accounts for all business expenses.
Frequently asked questions
Below are some additional questions often asked about the net profit margin.
Does a high net profit margin mean that cash flow is strong?
No, not necessarily. A company can have a high net profit margin relative to peers while also suffering low or diminishing cash flows.
Does company age matter when comparing peers in the same industry?
Yes. Often, a new business will have a relatively low net profit margin because it needs to take on a lot of costs before it can begin to generate revenue.
This is why it's important to consider additional factors beyond net profit margin, even when making comparisons within the same industry.
Can there be an inverse relationship between profit margin and sales?
Yes. Industries like manufacturing can sometimes experience falling profit margins despite an increase in sales. This is because to support the higher sales, the business needs to hire people, and that added cost reduces margins.
The takeaway
Net profit margin provides an overall picture of a company's profitability.
Put simply, net profit margin is the net profit a company earns per dollar of revenue. For example, a company with a net profit margin of 20% will keep $0.20 for every dollar generated in sales.
The figure can be calculated by dividing the net profit of a company by its revenue. Both of these numbers are located on the income statement.
Interpreting the net profit margin requires context — it's a good idea to compare the figure to that of a competing company or to the industry average net profit margin.
However, remember this is only one part of the picture and a more complete analysis will provide a better understanding of the company's financial position.