Gross Margin


The gross margin measures the percentage of revenue a company retains after deducting the costs of producing the goods or services it sells.
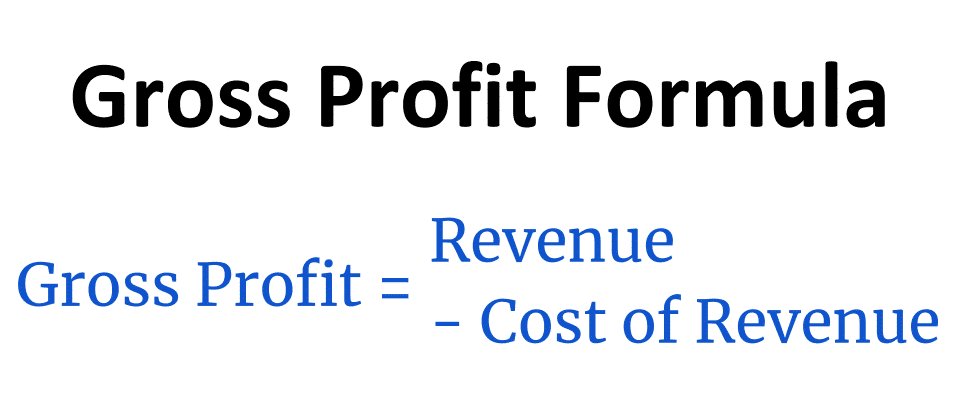
It's calculated in two parts: (1) by first subtracting the costs of goods sold (COGS) from revenue to arrive at gross profit, and (2) then dividing that number by revenue to result in a percentage. Here is the formula:
Gross margin = (revenue - COGS) / revenue
This profitability ratio evaluates the strength of a company's sales performance in relation to production costs. The higher the gross margin, the more profit a company is retaining.
The gross margin is also known as the gross profit margin or gross margin ratio.
What is the gross margin?

The gross margin measures the percentage of revenue a company retains after deducting the cost of goods sold (COGS).
It's considered the best way to evaluate the strength of a company's sales performance by assessing how much profit is generated compared to the costs of production.
In general, the higher the gross margin, the more revenue a company retains per dollar generated. However, keep in mind that other factors can impact this figure, such as industry, company size, and other external factors.
The best way to evaluate a company's gross margin percentage is to analyze the trend over time and compare it to peers or the industry average.
Worth noting, the net margin is a closely related metric. While the gross margin only accounts for a company's COGS, the net margin accounts for COGS plus all indirect, interest, and tax expenses.
Both views provide insights into different aspects of the company's operations.
SummaryThe gross margin is the portion of revenue a company maintains after deducting the costs of producing its goods or services, expressed as a percentage. It's useful for evaluating the strength of sales compared to production costs.
Gross margin: uses and significance
The gross margin provides insights into a company's financial health. It can be used to (1) evaluate profitability, (2) help set pricing, and (3) make comparisons between peers.
1. It's a simple profitability evaluation
The gross margin is an easy, straightforward calculation that provides insights into profitability and performance.
Additionally, it shows cost efficiency and can serve as an easy way for companies and investors to track performance over time.
2. It helps determine pricing and improvements
Companies can use gross margin as a guideline to improve their operations and adjust pricing strategies.
Moreover, gross margin can help identify which products and services are most cost-effective and which areas need improvement.
3. It can serve as an industry benchmark
Investors can compare a company's gross margin to industry averages and competitors to assess whether the company's gross profit is healthy and sustainable.
In general, a higher gross margin is better, so a company should strive to have a gross margin that's similar to or higher than its peers and industry average.
SummaryThe gross margin provides a straightforward evaluation of a company's financial health, serves as a guideline for pricing, and is a valuable tool when comparing a company's performance to industry benchmarks and competitors.
Gross margin formula and example calculation
Gross margin is calculated by dividing gross profit by revenue. But first, you'll need to calculate gross profit by subtracting COGS from revenue.
The two steps of the formula look like this:
- Gross profit = revenue - COGS
- Gross profit margin = gross profit / revenue
Therefore, the formula for gross margin looks like this:
Gross margin = (revenue - COGS) / revenue
To express this number as a percentage, simply multiply it by 100.
The inputs needed for this calculation can be found on a company's income statement, which is part of its 10-Q or 10-K filing.
You can also use websites like Stock Analysis to calculate this metric for you.
Example calculation
Below is a real-life example calculation using the income statement from Procter and Gamble's (PG) latest 10-Q filing.
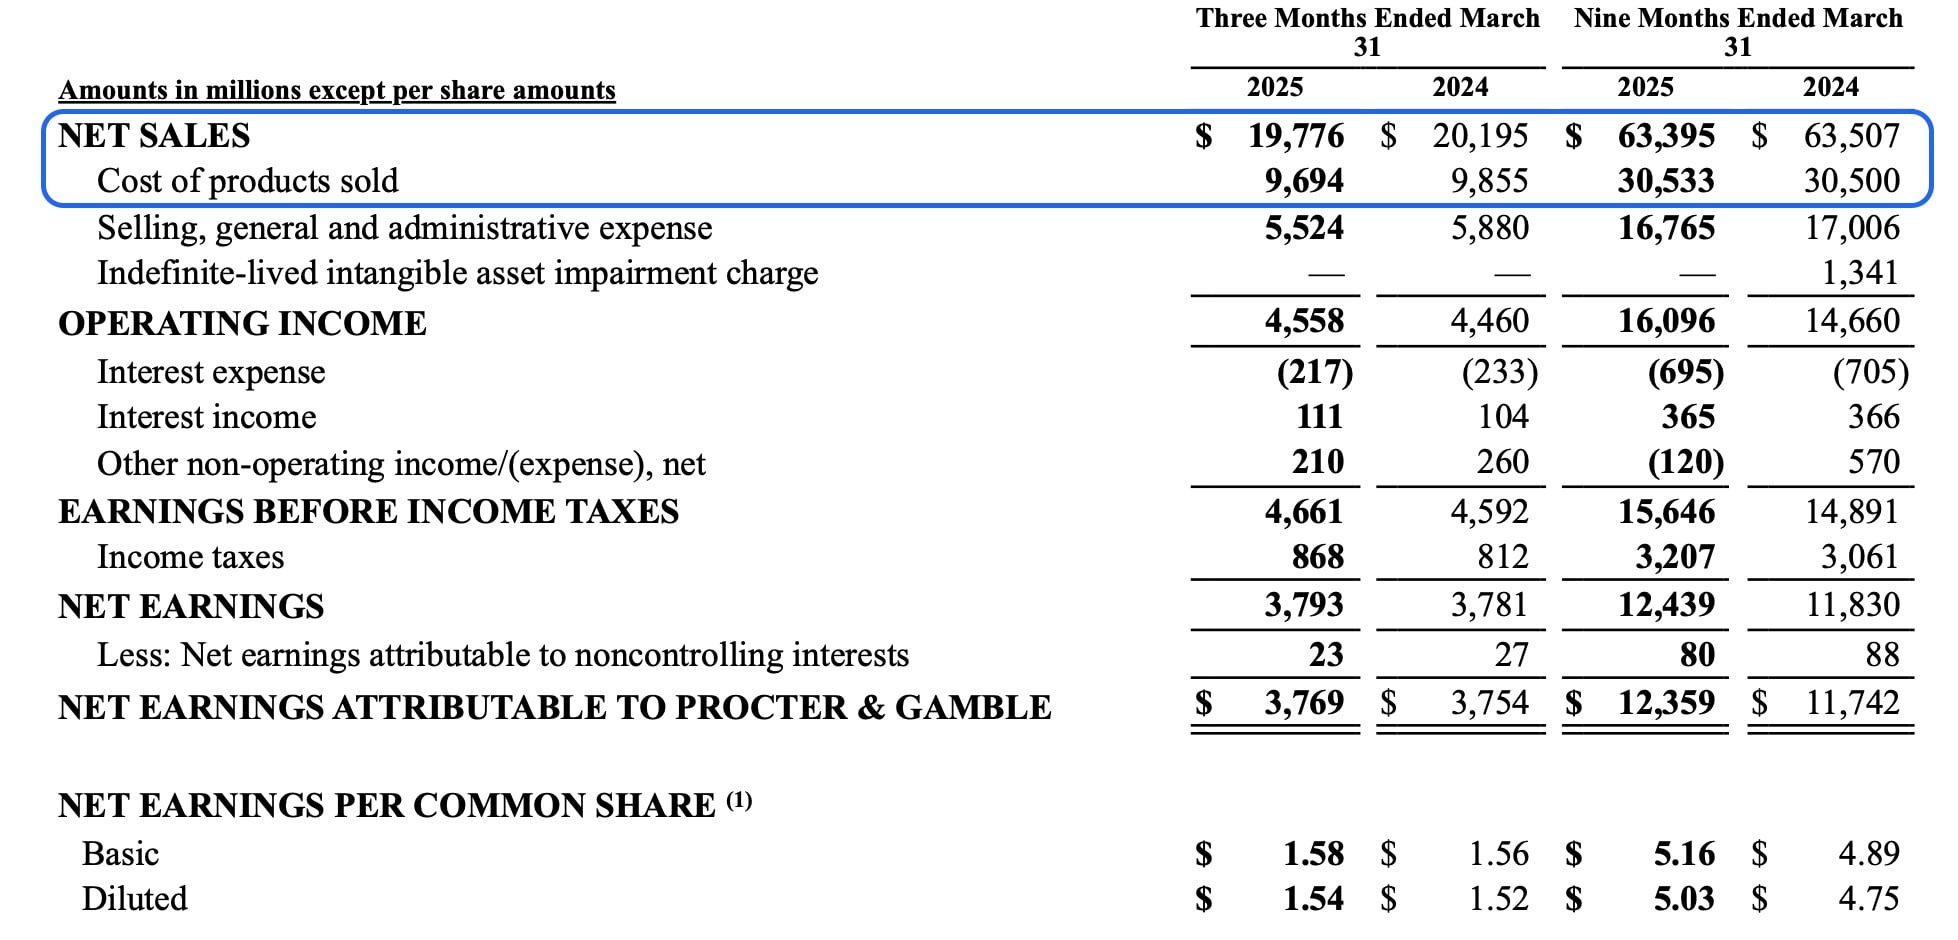
Source: Proctor and Gamble's 10-Q
For the quarter that ended on March 31, 2025, PG had USD $19,776 (in millions) in revenue, shown as net sales. Its COGS was USD $9,694 (in millions).
You can then calculate the gross margin like so:
- $19,776 - $9,694 = $10,082
- $10,082 / $19,776 = 0.5098
You can multiply this number by 100 to arrive at a percentage, which is 50.98%.
SummaryGross margin is calculated by first subtracting COGS from revenue to arrive at gross profit, and then dividing that number by revenue to determine the gross margin. That number can then be multiplied by 100 to express gross margin as a percentage.
How to interpret the gross margin
What's considered a “good” gross profit margin varies widely by industry.
The best way to interpret a company's gross margin is to analyze the trends over time and compare the number to the industry and peers.
Assess the trends over time
One way to interpret a company's gross margin is to compare it to previous calculations and see how it's trending over time.
Ideally, you want to see the number increase. This shows the company is improving its profitability and efficiency, retaining more money per each dollar of revenue generated.
As an example, here are PG's numbers again (including past data):
Source: Proctor and Gamble's 10-Q
As determined previously, PG's gross margin for the quarter that ended on March 31, 2025, was 50.98%. Here is the calculation for the previous quarter (in millions):
- $20,195 - $9,855 = $10,340
- $10,340 / $20,195 = 0.5120
Multiplied by 100, this means the gross margin is 51.20%.
Looking at these two numbers, you can see that PG's gross profit margin decreased a little over this time. However, this is not a significant figure and means the gross margin was little changed.
When the gross margin decreases at higher levels than this or continues to decline over time, it may indicate poor management, declining sales, manufacturing issues, or economic problems such as inflation.
Compare to peers and the industry or sector average
Another way to interpret a gross margin number is to compare it to the sector average and top competitors during the same period, such as annually or quarterly.
With PG, the sector would be other consumer staples companies. These produce or sell goods and services that are always in demand, like food and beverages, household products, and personal care products.
You can use our stock screener tool to check out the gross margin numbers for consumer staple stocks — just filter by "sector (consumer staples)" and "gross margin."
You can also dive deeper, analyzing how PG compares to its top competitors. Two such companies are Colgate-Palmolive (CL) and the Kimberly-Clark Corporation (KMB).
You can either calculate gross profit yourself using the companies' income statements or look up the companies on a financial data website, which is probably the quickest.
Additionally, it's important to conduct a longer-term analysis to ensure growth trends are ongoing.
SummaryThe best way to assess a company's gross margin number is to conduct a long-term analysis of trends, comparing the company to itself, or to compare it to peers and the sector average. Overall, you want to see a strong number trending up.
Gross margin vs net margin
The gross margin and the net margin, or net profit margin, are frequently used in tandem to provide a comprehensive look at a company's financial health.
The gross margin is extremely simple, straightforward to calculate, and provides an instant snapshot of how much revenue is retained after production costs are deducted.
This can be used to make decisions related to production, pricing, efficiency, etc.
However, it doesn't tell you the whole picture of a company's profitability because it excludes all other expenses like depreciation and amortization; selling, general, and administrative (SG&A); interest expenses; non-operating expenses; and taxes.
These expenses can have a considerable impact on a company's profitability, and evaluating a company only based on its gross margin can be misleading.
This is where the net profit margin comes into play, as it goes further than gross margin.
It accounts for all the indirect costs that the gross margin ignores, as well as interest and tax expenses. This is why the net margin is considered the most comprehensive profitability metric and is very useful alongside gross margin when evaluating a company.
SummaryThe gross margin and net margin are frequently used together to provide a comprehensive overview of a company's financial health. Where the gross margin only accounts for the COGS, net margin accounts for all indirect, interest, and tax expenses.
The takeaway
The gross margin is an important and widely used financial analysis ratio.
It's very straightforward to calculate, providing an instant look at how much revenue a company retains after subtracting the cost of producing its goods and services.
To interpret this ratio, you can conduct a long-term analysis of the company's gross margin trends over time or draw comparisons between peers and the sector average.
The gross margin can also provide insights into which products and services are the most efficient to produce and sell, as well as where to make cost improvements.
Additionally, you can use gross margin alongside other metrics, such as net margin or even operating margin, for a more comprehensive financial overview.
Taken altogether, the gross margin can provide valuable insights to investors and researchers.